
Dry lab · Model
Model
Modeling that informed the design and how it fed back into our decisions.
A famous study said a special food helps undernourished kids grow by changing their gut bacteria. We wanted to see if we could rebuild that result ourselves from the public data. We could not check the growth part, because that data is private. So we checked what we could: which bacteria differ between the two foods. Then we went further and modeled what those bacteria actually make.
What we could check, and what we could not
In 2021, a study in the New England Journal of Medicine showed that a special food called MDCF-2 helped undernourished kids in Bangladesh grow faster than a normal supplement, and that it worked by changing their gut bacteria. We wanted to know how much of that we could get back on our own. So we took their public data and redid the analysis from scratch.
First, one thing to get straight. The study’s big finding links bacteria to how each child grew. To check that, you need each child’s growth measurements, and those were never released. So we could not redo that part. What we could ask instead is: which bacteria differ between the two foods? These are not the same question. A bacterium could help growth in both foods and still look the same between them. Keeping these two questions separate ended up mattering a lot for how we read our results. So we answered the food question carefully, then used metabolic modeling to ask what the growth bacteria are actually doing.
1. Why this study, and what we set out to do
Calories alone do not fix undernutrition in young kids. The Gordon lab found that undernourished kids have a gut microbiome that looks too young for their age, and that the right food can push it back toward normal. MDCF-2 was built to feed specific helpful bacteria. In the trial, kids on MDCF-2 gained weight faster than kids on the normal food (RUSF), and that matched a certain group of growth bacteria.
A result that big is worth double-checking, especially by an outside group using only public data. So we had two goals. One: rebuild the bacteria analysis from the raw data and see which findings hold up when the statistics are done right (each kid gave several samples, and that has to be handled carefully). Two: go past just counting bacteria and look at what they can make, so we could come up with testable ideas for how they might help growth.
It is easy to mix up the trial’s question and ours, so Figure 1 puts them side by side. The trial asked which bacteria drive growth. That needs the per-kid growth data we do not have. We asked which bacteria differ between the two foods. A bacterium can matter for growth in both foods and still look the same between them. So “no difference between foods” does not mean a bacterium has no role in growth.

2. How we did it
Our analysis is a sequence of models of increasing statistical stringency, followed by a metabolic model. We state each one formally here and refer back to these equations in the Results.
2.1 Sequence processing
Paired-end reads were imported into QIIME 2 and denoised into amplicon sequence variants (ASVs) with DADA2, which models and corrects the per-run error process rather than clustering by a similarity threshold. Reads were truncated at 220 bp (forward and reverse) based on quality profiles, and ASVs were retained at a minimum frequency of 10 across at least two samples. Taxonomy was assigned with a naive Bayes classifier trained on SILVA 138; because SILVA resolves these amplicons only to genus for this cohort, we later re-classified against GTDB r207 for compatibility with the metabolic database (Section 2.5). A phylogeny was built with MAFFT alignment and FastTree 2 for the diversity analyses.
2.2 Diversity and community-level testing
Within-sample (alpha) diversity used Faith’s phylogenetic diversity and Shannon and observed-feature indices. Between-sample (beta) diversity used weighted and unweighted UniFrac, visualized by principal coordinates analysis. Whether a grouping variable separated communities was tested by PERMANOVA with 999 permutations, reporting the pseudo-F and the variance fraction R².
2.3 Finding real differences in messy percentage data
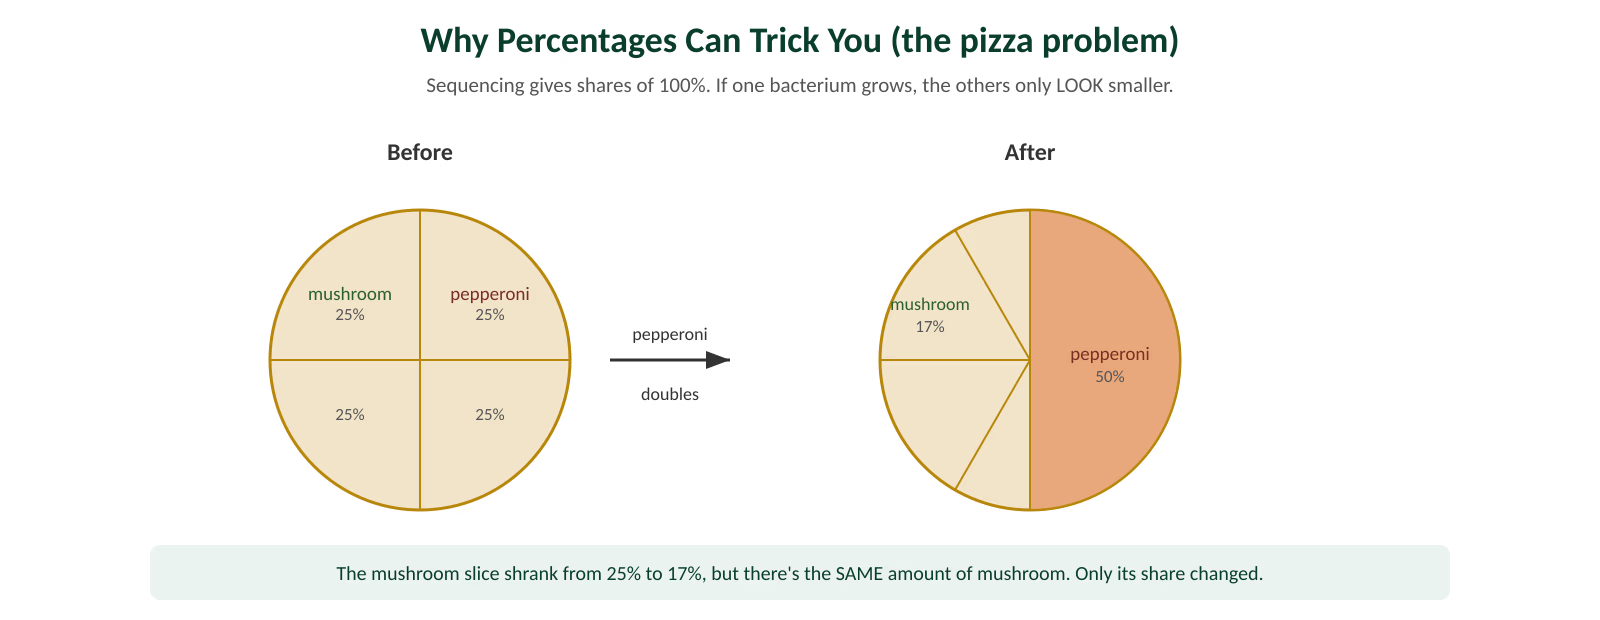
Amplicon data are compositional: counts carry only relative information, so an increase in one taxon mechanically lowers the apparent fraction of all others. A naive t-test on proportions therefore produces false positives. We used two complementary approaches. ANCOM-BC2 estimates and corrects the sampling-fraction bias, modeling the observed abundance Oij of taxon i in sample j as
where μi is the taxon mean, xj the sample covariates (arm, timepoint), βi the effects of interest, dj the unknown per-sample log sampling fraction that ANCOM-BC2 estimates, and εij residual error. In parallel we used MaAsLin2 with a total-sum-scaling normalization and log transform.
2.4 Counting each child once, not eight times
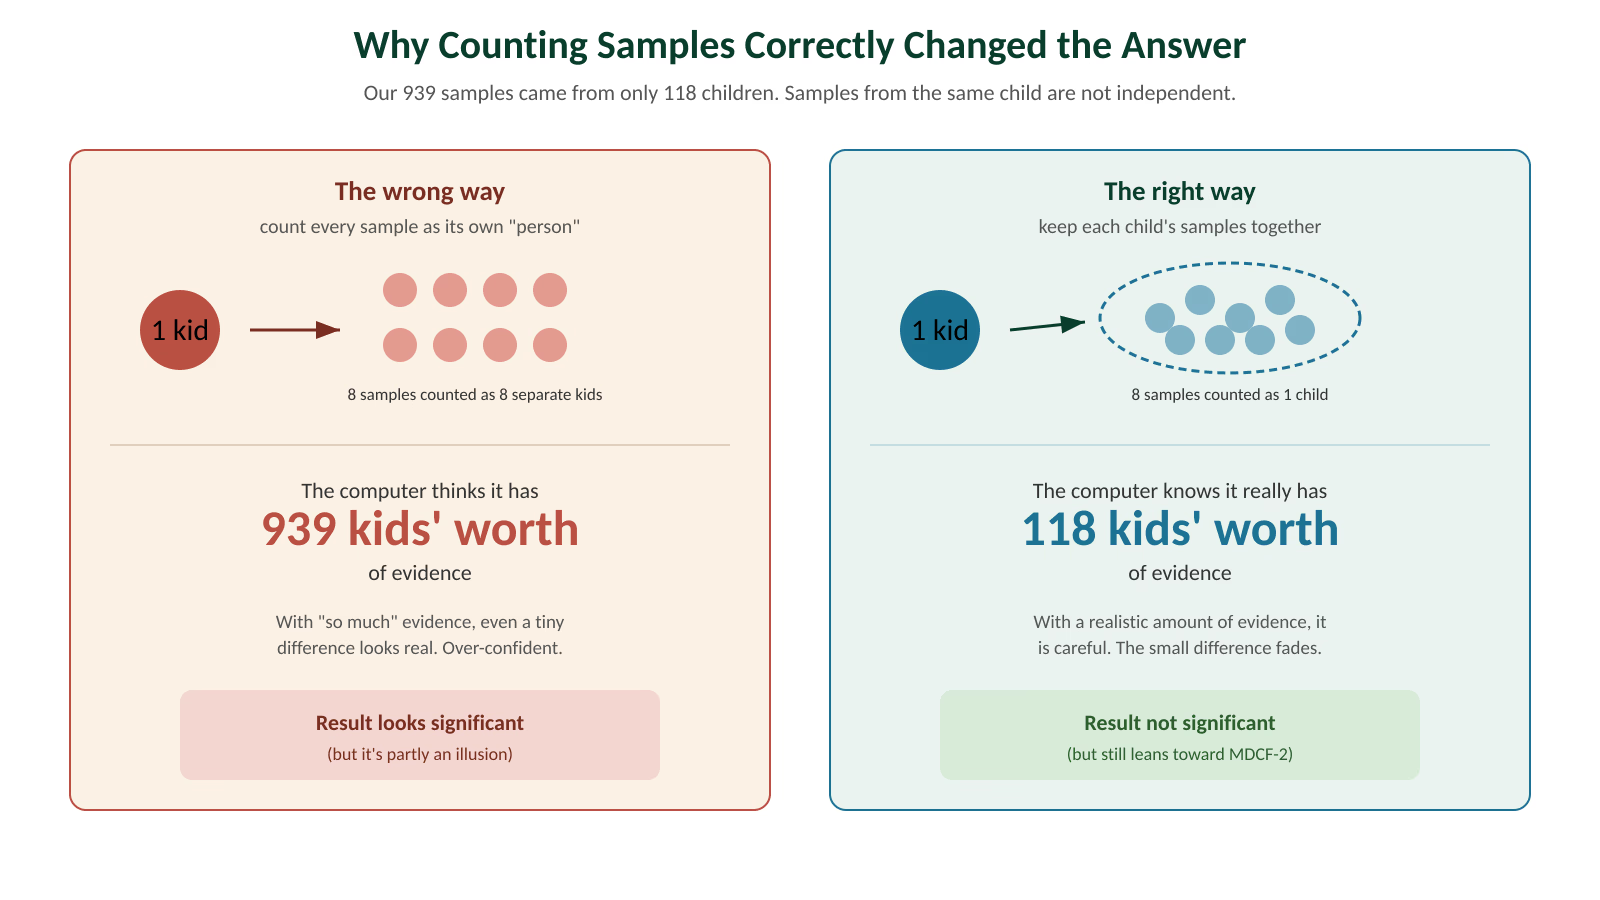
The design is the crux. Each child contributed roughly eight samples, so samples are not independent; treating them as independent inflates the effective sample size (pseudoreplication). The correct model for the transformed abundance yij of a taxon in child i at sample j is a linear mixed-effects model:
- β1 is the diet-arm effect, the quantity of interest (MDCF-2 as reference).
- β2 absorbs the timepoint so an arm effect is not confounded with developmental change.
- ui is the per-child random intercept: it encodes that a child’s samples share a baseline, which is what prevents one child from counting as many.
- The intraclass correlation ρ = σu2 / (σu2 + σε2) measures how much of the variance is between children; the larger it is, the more pseudoreplication would have mattered.
Across the many taxa and metabolites we test, we control the false discovery rate by the Benjamini-Hochberg procedure: for m ordered p-values p(1) ≤ … ≤ p(m), we reject up to the largest k with
2.5 Community metabolic modeling
To move from composition to function we used MICOM, which assembles a community genome-scale model from per-sample taxon abundances and the AGORA2 reconstruction database. Each taxon’s metabolism is represented by a stoichiometric matrix S; growth and exchange fluxes v are found by constrained optimization (flux balance analysis) subject to steady state and a shared external medium:
MICOM resolves the trade-off between community-level and individual-taxon growth with a cooperative-tradeoff parameter; we used 0.3 after the stricter 0.5 setting failed to converge on this cohort. Coverage of the model database depends on taxonomy: SILVA names matched AGORA2 for only 53% of abundance, so we re-classified against GTDB r207, which raised coverage to 95%. Three of the 939 samples did not yield a viable community model (too few of their taxa mapped to AGORA2 for the solver to assemble and grow a community), so the metabolic analyses run on 936 samples. The medium was the standard western-diet gut reconstruction shipped with AGORA2, a limitation we return to.
We summarized cross-feeding two ways. Community-level production of a metabolite is its export flux in the shared (“medium”) compartment. Pairwise exchange between taxa, and each metabolite’s Metabolic Exchange Score (MES, the harmonic mean of the number of producers and consumers, high when a metabolite is widely traded), were computed with the method of Marcelino et al. AGORA2 includes xenobiotic-degradation reactions; we excluded drug and xenobiotic pseudo-metabolites from the exchange summaries by name.
2.6 A small model of our own
To test whether a simple mechanism can explain our central metabolic observation (Section 4.4), we built a minimal resource-competition model of the acetate-to-butyrate hand-off. Let A be shared acetate and B free butyrate in the lumen; let P, F, C be the abundances of acetate producers, butyrate-forming consumers (Faecalibacterium-type), and non-butyrogenic acetate consumers (Prevotella-type), with first-order lumenal washout D:
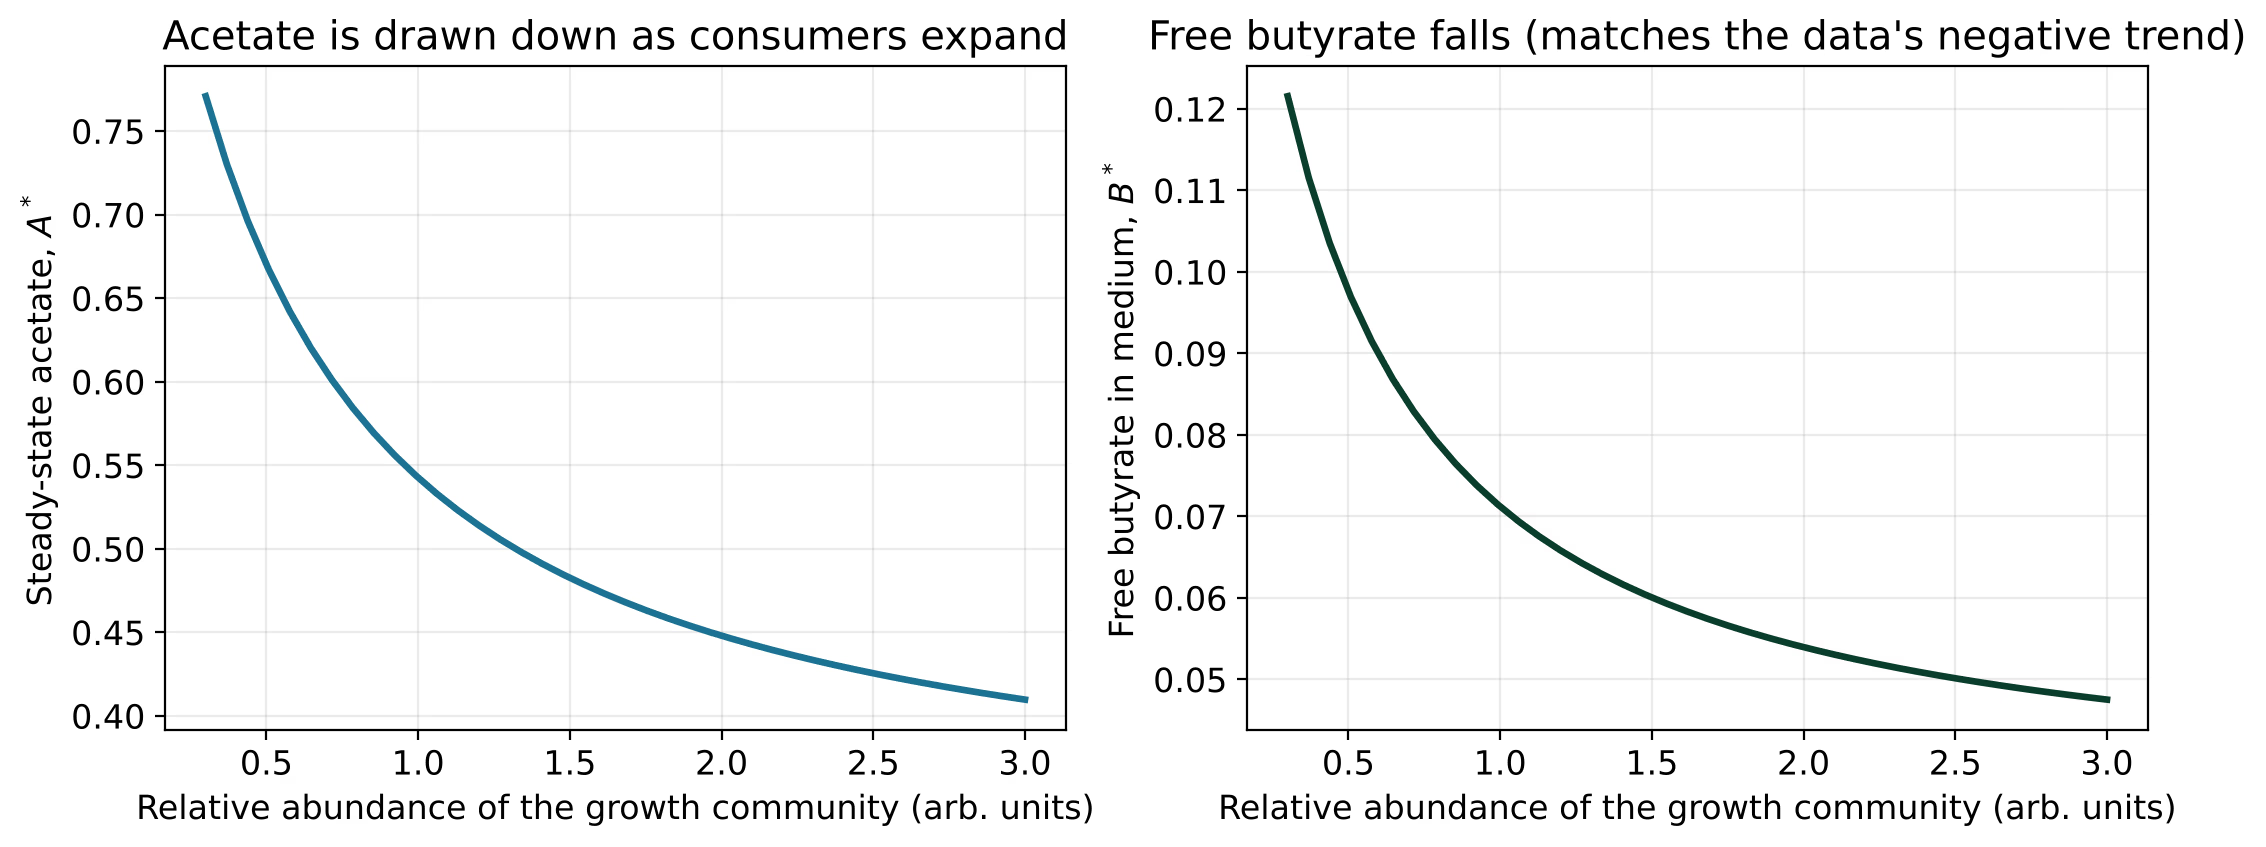
Equation (4) says acetate is produced by P and competed for by the butyrate-former F and the non-butyrogenic consumer C through saturable (Michaelis-Menten) uptake. Equation (5) says butyrate is made from the acetate that F takes up (yield Yb) and partly re-consumed by C. The growth-associated community is dominated by C (Prevotella is the single most abundant taxon and a net acetate eater, Section 4.3), so as the community expands, C rises fastest. We solve for the steady state (A*, B*) numerically and compare the sign of dB*/dG against the data.
2.7 Building a diet that fits these children
MICOM needs a “diet”: a list of the raw nutrients available to the bacteria, with an amount for each. The tool ships with a Western-adult diet, and that is what every result above used. Since our kids eat a very different diet, we built one to match and re-ran the metabolic comparison on it (Section 4.6). Here is exactly what we did, so it can be checked and improved.
Our approach was to start from the Western diet and move each nutrient group in the direction a rural Bangladeshi complementary diet points, rather than inventing a diet from nothing. The target was the real diet of these children: rice and lentils as the staples, not much fat or animal protein, and breast milk for the younger ones. Concretely, we raised the staple starches (rice is mostly starch) and added plant fibers that come with rice and pulses (cellulose, xylan, pectin and related fibers), since the Western diet carried almost none of these. We lowered total fat (oleate, palmitate and stearate) and trimmed the sulfur amino acids that come mainly from meat (cysteine and methionine). We raised the milk sugars lactose and galactose, plus fucose, for the breastfed children. Every single change, the nutrient, the old value, the new value and a one-line food reason, is written to a table (medium_changes.csv) in the code bundle, so a reviewer can see our reasoning line by line and disagree with any of it.
After adjusting the diet, we used MICOM’s own medium-completion step to add back any trace nutrients the bacteria strictly need to grow (so a sensible diet does not accidentally starve them on a missing vitamin). We then checked that the bacteria could actually live on it: 560 of 585 genus-level models grew. That number is the proof the diet is usable, not a starvation medium.
How far we got, stated honestly
This is a reasoned approximation, not a gram-by-gram reconstruction from a weighed food diary. We moved nutrient groups in the right direction and documented every move, which is enough to ask “does a fitting diet change the answer,” but it is not a validated food model. The fully rigorous version would start from a weighed food record run through a diet-design tool (like the VMH diet designer), and the bundle’s code notes exactly where that would plug in. We also ran the comparison on all 936 samples, the same scale as the Western-diet comparison, so the Section 4.6 result stands on equal footing with the rest of the page. In short: the diet is built, documented, runnable, and run on the full cohort, and it gives the same no-difference answer as the Western diet. The one thing left to make it even more rigorous is a gram-accurate food reconstruction, which the bundle shows how to do.3. Part 1: can we reproduce the bacteria findings?
3.1 The data is solid
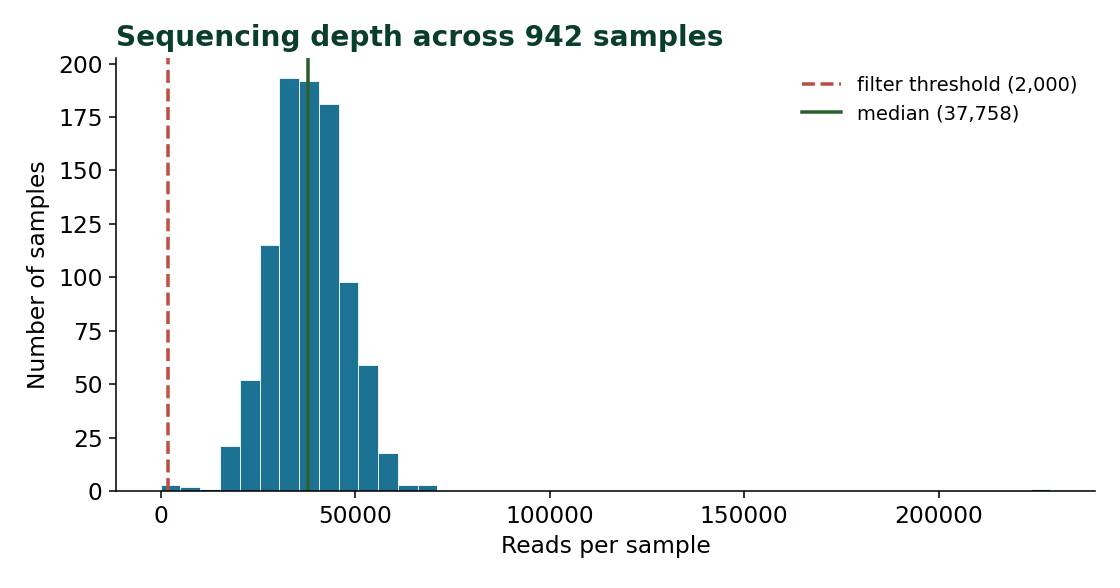
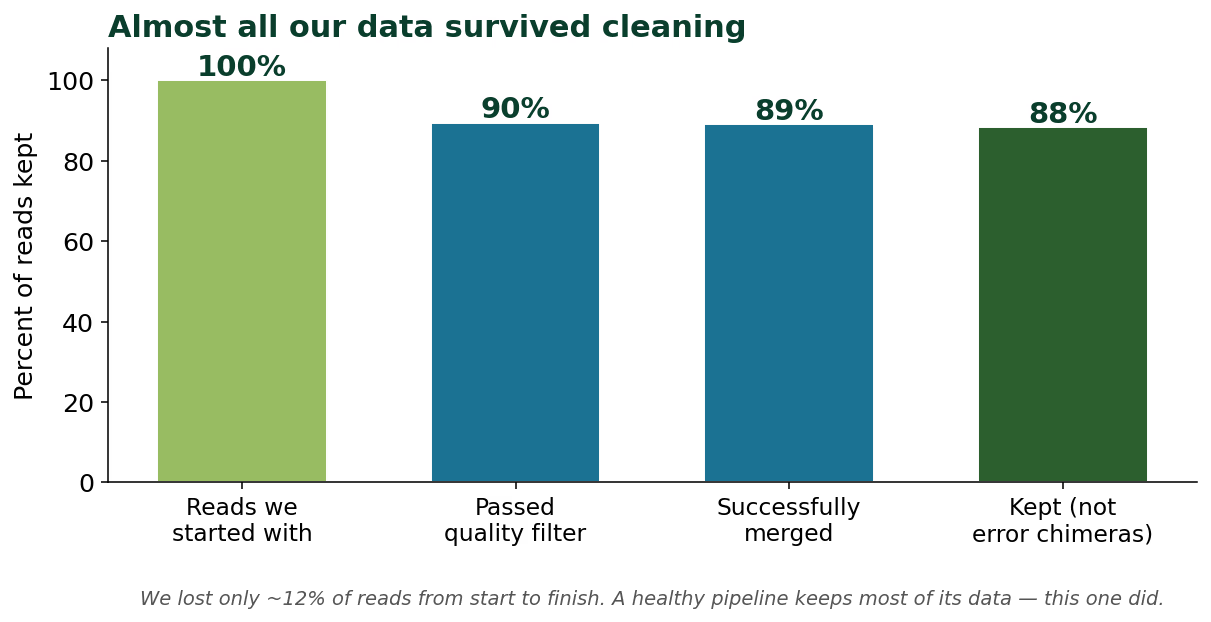
Of 942 samples, only three fell below the 2,000-read floor, and about 88% of reads survived the full DADA2 pipeline (Figure 2). A retention this high indicates the public data are clean and our processing choices are not discarding signal.
3.2 What is there, and what we cannot name
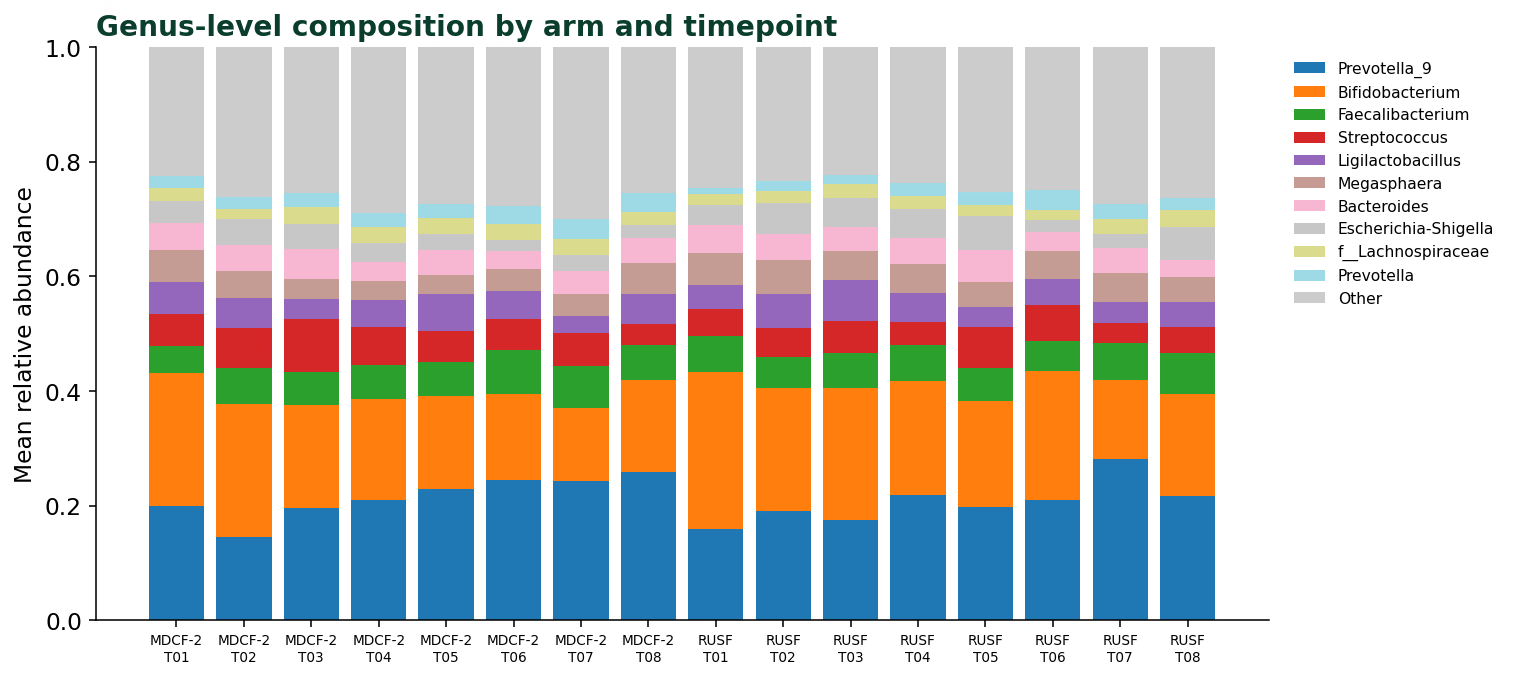
Bifidobacterium, Prevotella and Faecalibacterium dominate the communities, and the mix shifts over the study (Figure 4). One limit to know up front: our 16S data only names bacteria down to genus, not species. None of our 307 taxa got a species label. The trial named species like Prevotella copri, but it did that by matching to cultured strains, not from the sequences alone. So we work at the genus level and compare which direction things move, instead of claiming an exact species.
3.3 Time matters more than diet
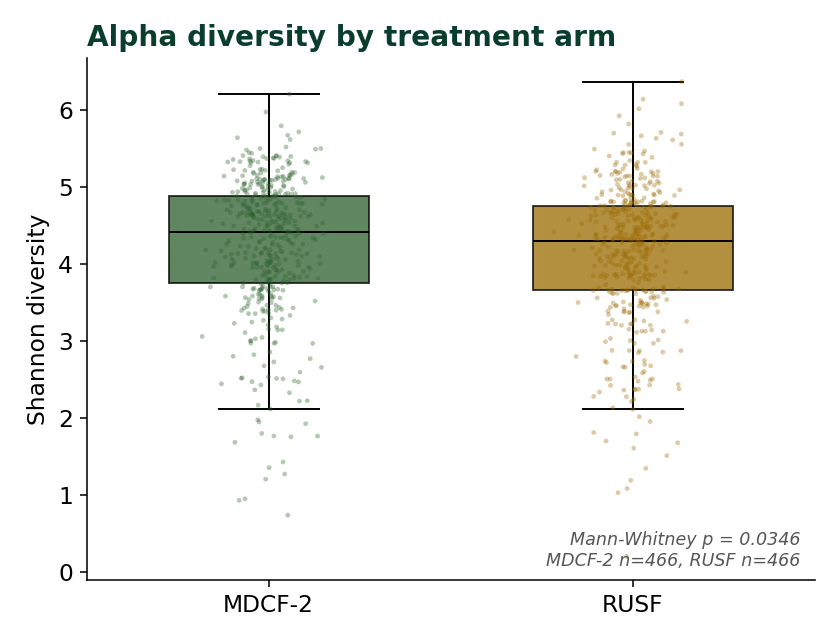
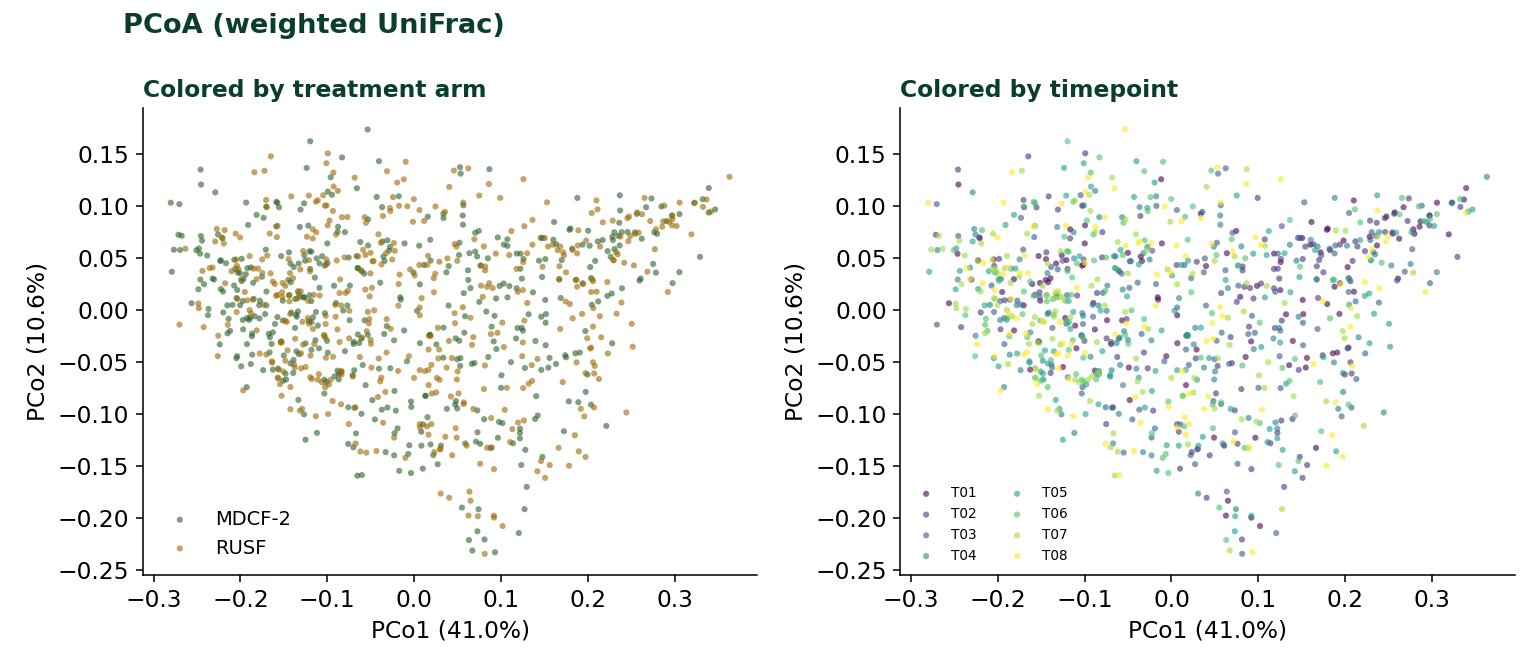
Alpha diversity is marginally higher under MDCF-2 (p=0.035; Figure 5), a small but real difference. The beta-diversity picture is the more important one: in ordination the two arms are fully intermixed, while samples separate by timepoint (Figure 6). PERMANOVA agrees, timepoint explains roughly ten times the variance that arm does (time R²≈3.3%, arm R²≈0.3%; both pass significance, but the effect sizes are not comparable).
3.4 An exciting result that did not survive
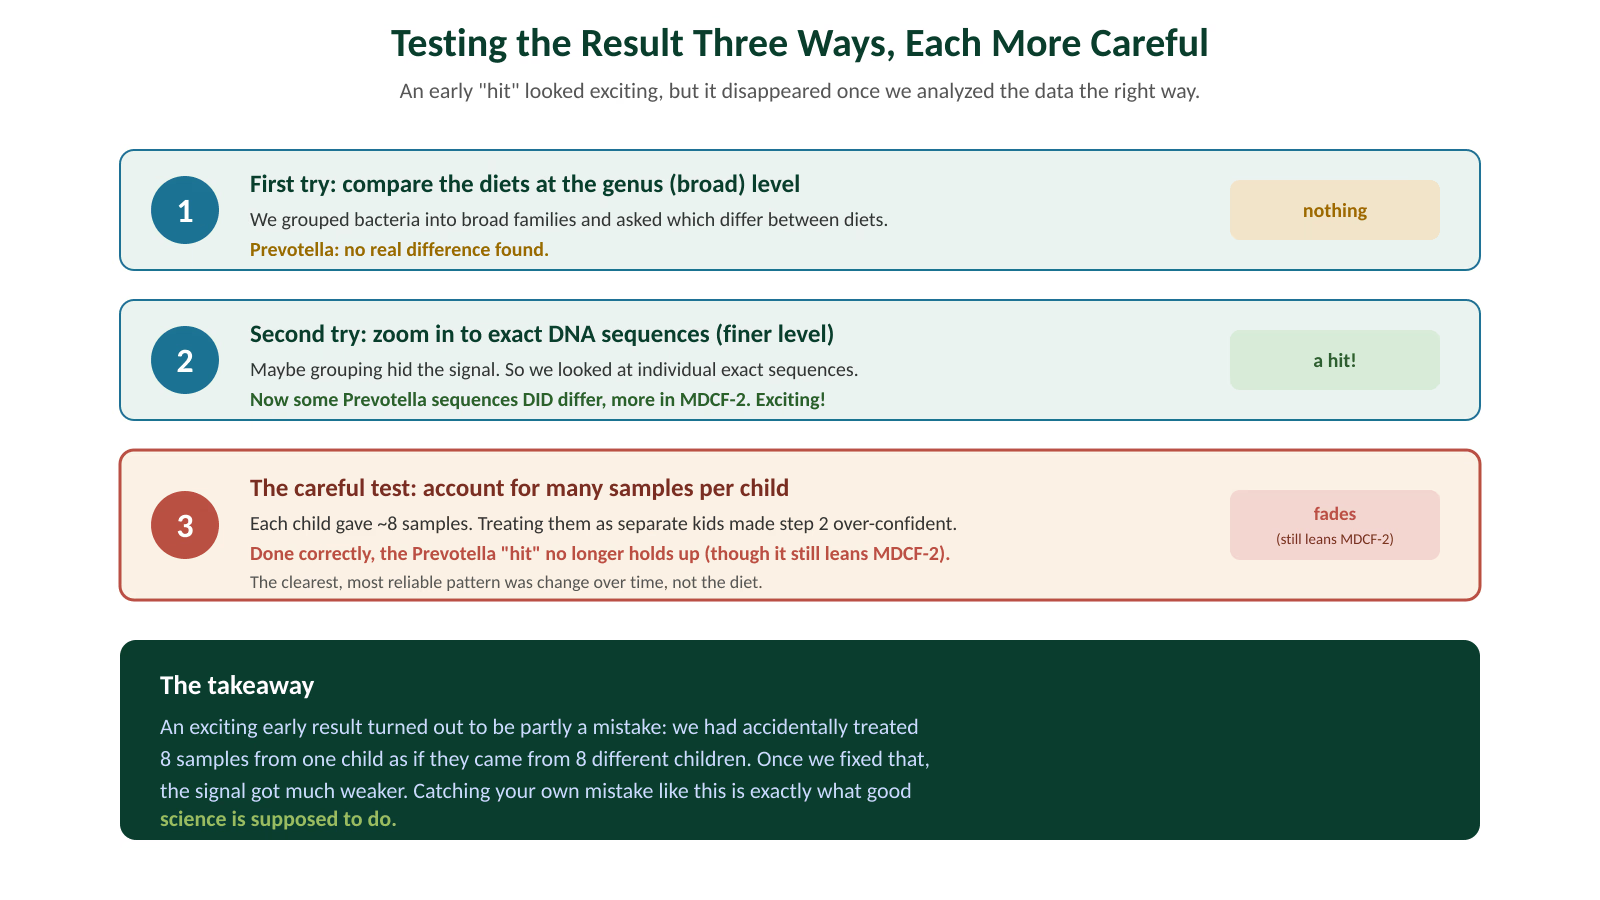
We checked whether diet changes Prevotella three ways, getting stricter each time (Figure 7). At the genus level: nothing. Zoomed in to individual ASVs: a real-looking hit, higher on MDCF-2. But with the mixed model of Equation (1), which properly handles the eight samples per kid, the hit fades to a lean that is not significant. Figure 8 shows why raw percentages can fool you, and Figure 9 shows the sample-counting problem.
3.5 What the diet comparison shows
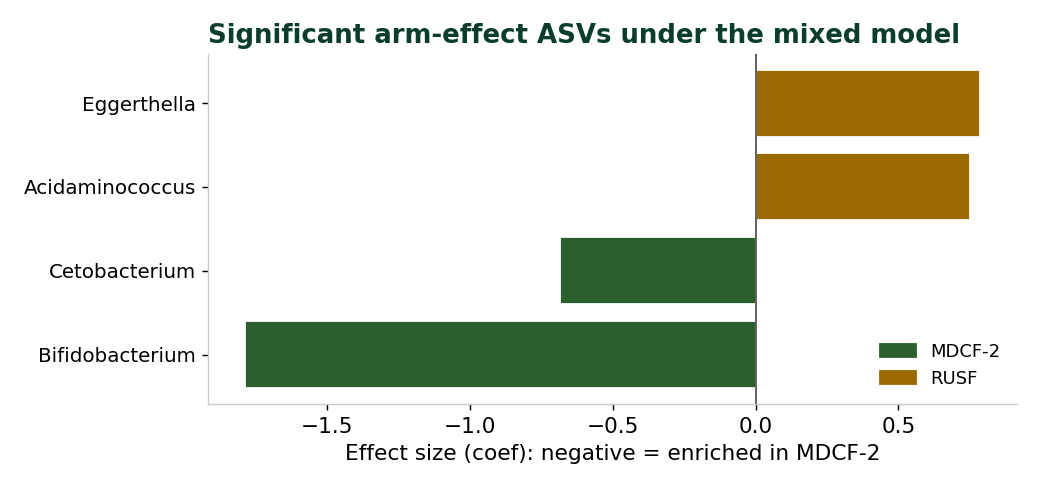
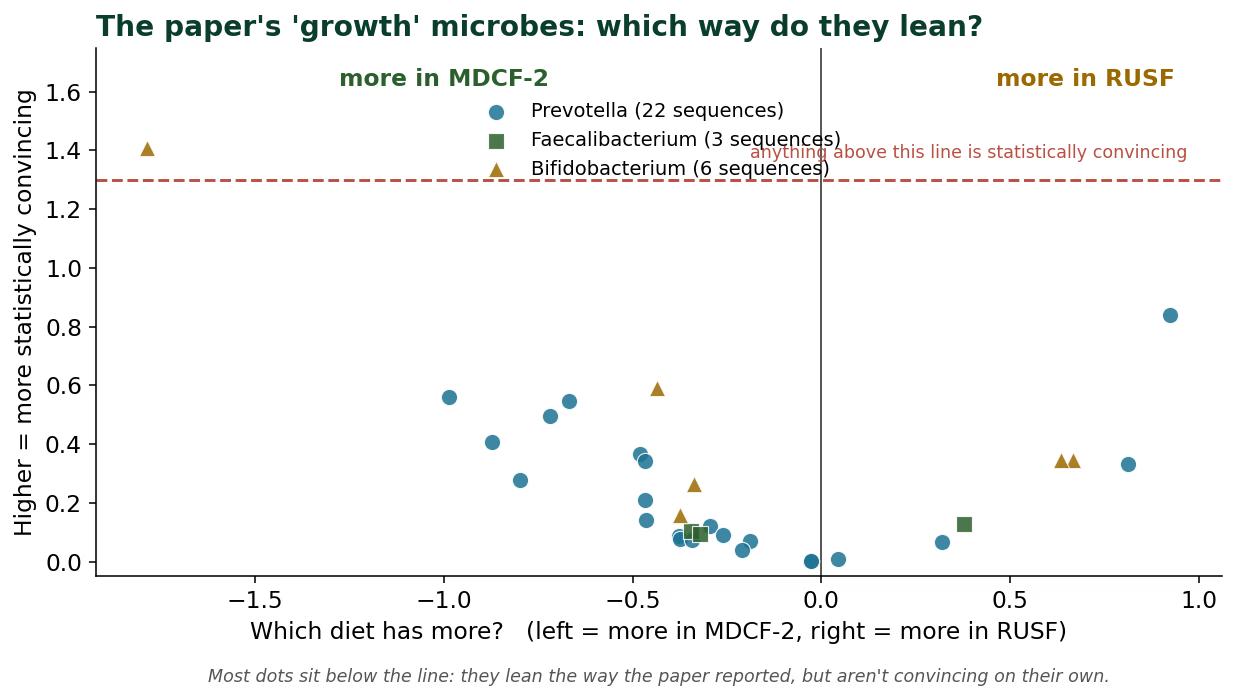
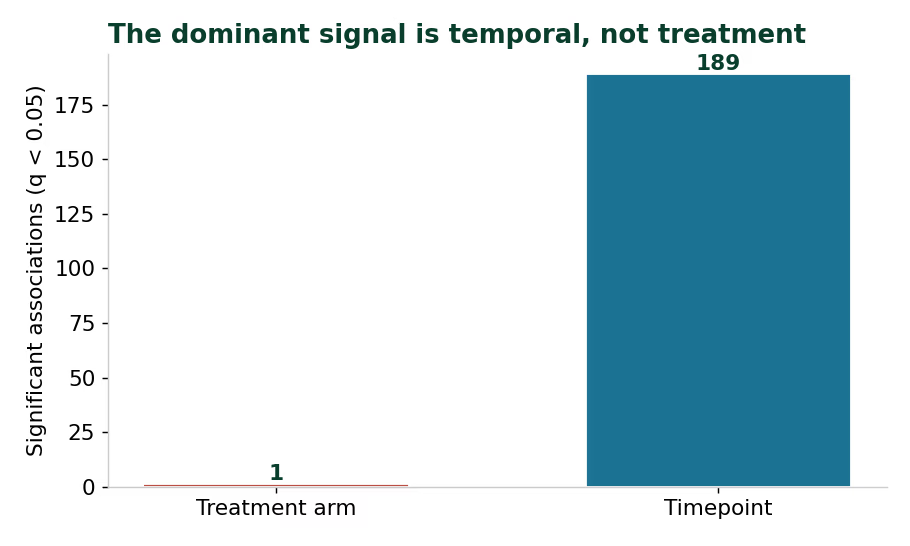
The Prevotella arm difference only looks convincing in the model that counts samples incorrectly (table below). Our differential-abundance tests were not empty, though: the stricter compositional method (ANCOM-BC) flags a handful of genera that differ between the foods, led by Bifidobacterium, which is lower under MDCF-2. The trial also reported bifidobacterial depletion, so our arm result and their observation point the same way for this genus. The paper’s other named genera lean the direction the paper reported but sit below significance individually in our arm comparison (Figure 11). Remember that the study’s case for Prevotella came mainly from its link to growth, which our data cannot test. So finding no food difference here neither confirms nor contradicts that. Then we counted up every change the model found and sorted it into two kinds. A treatment (arm) effect means a bacterium differs between the two foods, MDCF-2 versus RUSF. A timepoint effect means a bacterium changes from the start of the study to the end, regardless of which food the child was on. These are different questions: one asks “does the food matter,” the other asks “does anything change over the months of the study.” When we tallied them, timepoint effects outnumbered food effects by a wide margin (Figure 12). In plain terms, far more bacteria changed over time than differed between the two foods. That is the same message as the diversity result in Figure 6, where samples lined up by time, not by food, and it is why we keep saying time is the bigger driver here. The one caution is that we cannot fully separate “changed over time” from “the child simply got older,” so we read the time effect as real but not purely food-driven.
It helps to say which bacteria these effects are. On the time side there are 60 genera (55 named at genus level), and they move in a consistent pattern. The ones that drop over the study are Bifidobacterium and Limosilactobacillus (a Lactobacillus), the classic milk-fed, infant-gut bacteria. The ones that climb are the fiber fermenters and butyrate makers of an older gut: Faecalibacterium, Roseburia, Blautia, Coprococcus, Butyricicoccus, Prevotella and Ruminococcus. In other words, over these few months the communities look like they are shifting from an infant-type gut toward an adult-type one, which is exactly why we are careful to call it time and not diet: a lot of this is probably the children simply getting older. On the food side there is almost nothing by comparison. A stricter compositional method (ANCOM-BC) flags a short list of genera, led by Bifidobacterium sitting lower under MDCF-2, which matches the trial; the mixed model, which is our strictest test, barely flags any food difference at all. The two methods do not name exactly the same food hits, but they agree on the thing that matters here: time changes dwarf food changes.
| Model | Resolution | Prevotella result | Verdict |
|---|---|---|---|
| Arm comparison, broad | genus | no difference | null |
| Arm, treatment window only | genus | no difference | null |
| Arm, time-adjusted | genus | no difference | null |
| ASV differential abundance | ASV | higher in MDCF-2 | appears real |
| Mixed model, Eq. (1) | ASV | leans MDCF-2, n.s. | fades |
What “time” can and cannot mean
We call this a time effect, not maturation, on purpose. The study only runs about four months, and every kid is eating the supplement the whole time. So when a bacterium changes from start to end, we cannot tell “the gut grew up” apart from “the gut reacted to months of supplement.” The study is not set up to separate those two, so we use the weaker word.Supplementary: every significant association
This is the complete list behind Figure 12. The mixed model returns 189 significant timepoint rows, but the same genus is often significant at several timepoints, so those 189 rows collapse to 60 genera; we list all 60 below with the timepoints each was significant at. On the food side, the mixed model (our strictest test) flags a single genus, while the compositional method ANCOM-BC flags eight; both are shown. Every coefficient and q-value is in the code bundle.
| Genus | Direction | coef | q-value |
|---|---|---|---|
| Cetobacterium | higher under RUSF | -0.68 | 1e-2 |
| Genus | Direction (vs MDCF-2) | q-value |
|---|---|---|
| Eggerthella | lower under MDCF-2 | 2e-4 |
| Olsenella | higher under MDCF-2 | 3e-3 |
| Incertae Sedis | lower under MDCF-2 | 3e-3 |
| f: Oscillospiraceae | lower under MDCF-2 | 3e-3 |
| [Eubacterium] eligens group | higher under MDCF-2 | 3e-3 |
| UBA1819 | lower under MDCF-2 | 3e-3 |
| Prevotellaceae NK3B31 group | higher under MDCF-2 | 6e-3 |
| Oribacterium | higher under MDCF-2 | 2e-2 |
Timepoint associations, mixed model: 60 genera (189 rows). 14 genera fall from start to end, the infant-gut group:
| Genus | q-value | Significant at |
|---|---|---|
| Limosilactobacillus | 5e-10 | T04, T05, T06, T07, T08 |
| Bifidobacterium | 6e-7 | T04, T05, T06, T07, T08 |
| family Lactobacillaceae | 2e-4 | T05, T06, T07, T08 |
| family Veillonellaceae | 3e-4 | T07, T08 |
| HT002 | 3e-4 | T05, T06, T07, T08 |
| Escherichia | 5e-4 | T04, T06, T07 |
| Anaerococcus | 6e-4 | T03, T04, T06, T07, T08 |
| [unclassified] | 1e-3 | T04, T05, T06, T07 |
| family Enterococcaceae | 8e-3 | T07 |
| Lactobacillus | 2e-2 | T05 |
| Finegoldia | 3e-2 | T07, T08 |
| Atopobium | 4e-2 | T08 |
| Morganella | 4e-2 | T06 |
| Libanicoccus | 5e-2 | T06 |
46 genera rise from start to end, the adult-type fiber and butyrate group:
| Genus | q-value | Significant at |
|---|---|---|
| Alloprevotella | 1e-6 | T05, T06, T07, T08 |
| Coprococcus | 2e-6 | T05, T06, T07, T08 |
| [unnamed genus] | 2e-6 | T04, T05, T06, T07, T08 |
| Asteroleplasma | 4e-6 | T07, T08 |
| Butyricicoccus | 4e-6 | T04, T05, T06, T07, T08 |
| UCG | 4e-6 | T06, T07, T08 |
| Blautia | 8e-6 | T04, T05, T06, T07, T08 |
| Faecalibacterium | 3e-5 | T04, T06, T07, T08 |
| family Lachnospiraceae | 3e-5 | T03, T04, T07, T08 |
| family Prevotellaceae | 3e-5 | T07, T08 |
| Holdemanella | 4e-5 | T06, T07, T08 |
| uncultured | 5e-5 | T06, T07, T08 |
| Prevotellaceae NK3B31 group | 6e-5 | T06, T07, T08 |
| Prevotella | 7e-5 | T06, T07, T08 |
| Succinivibrio | 7e-5 | T05, T07 |
| Prevotella 9 | 9e-5 | T06, T07, T08 |
| Catenibacterium | 1e-4 | T04, T05, T06, T07, T08 |
| Oribacterium | 1e-4 | T06, T07, T08 |
| Rikenellaceae RC9 gut group | 2e-4 | T07, T08 |
| Ruminococcus | 2e-4 | T05, T07, T08 |
| Lachnospiraceae UCG | 2e-4 | T04, T05, T06, T07, T08 |
| Colidextribacter | 3e-4 | T05, T06, T07, T08 |
| Roseburia | 3e-4 | T05, T07, T08 |
| Gastranaerophilales | 1e-3 | T08 |
| Anaerostipes | 1e-3 | T06, T07 |
| Family XIII UCG | 2e-3 | T07, T08 |
| Olsenella | 2e-3 | T06, T07, T08 |
| Agathobacter | 2e-3 | T05, T07, T08 |
| Slackia | 2e-3 | T06, T08 |
| family Anaerovoracaceae | 3e-3 | T07, T08 |
| Muribaculaceae | 4e-3 | T06, T07, T08 |
| Dialister | 4e-3 | T07, T08 |
| Helicobacter | 5e-3 | T05, T07, T08 |
| Intestinimonas | 6e-3 | T06 |
| Anaerovibrio | 7e-3 | T07 |
| Christensenellaceae R | 7e-3 | T06, T07, T08 |
| Dorea | 7e-3 | T06, T07, T08 |
| Megamonas | 7e-3 | T04, T05 |
| family Oscillospiraceae | 7e-3 | T06, T07, T08 |
| Fusicatenibacter | 1e-2 | T04, T05, T06, T07 |
| Family XIII AD3011 group | 1e-2 | T07, T08 |
| Prevotella 7 | 1e-2 | T07, T08 |
| Weissella | 2e-2 | T03 |
| Phascolarctobacterium | 2e-2 | T07 |
| Sutterella | 3e-2 | T07 |
| Lachnospiraceae ND3007 group | 4e-2 | T06, T07, T08 |
Timepoints are labeled T03 to T08. A few entries are family-level or unnamed at genus level where 16S could not resolve them; they are kept here exactly as the model reported them. The overall pattern is the one in the main text: infant-gut bacteria decline while adult-type fiber and butyrate genera rise, which reads as gut maturation over the study.
4. Part 2: from who is there to what they do
Counting bacteria tells you who is there and how much. But the bacteria probably matter for growth because of what they make: fermentation products, especially short-chain fatty acids, that feed the gut lining. 16S sequencing cannot see that. So we built community metabolic models for all 936 samples (Section 2.5) and asked what the growth bacteria add.
What a metabolic model does and does not claim
Keep one thing in mind for this whole part. MICOM predicts what the bacteria could make, based on which bacteria are there and what their genes can do. It does not measure what the gut actually made. So everything here is a prediction, not a measurement. That is still useful, because a good prediction tells you what to go measure next. But we say “predicted” on purpose and do not treat any of it as a fact.4.1 The two diets look the same here too
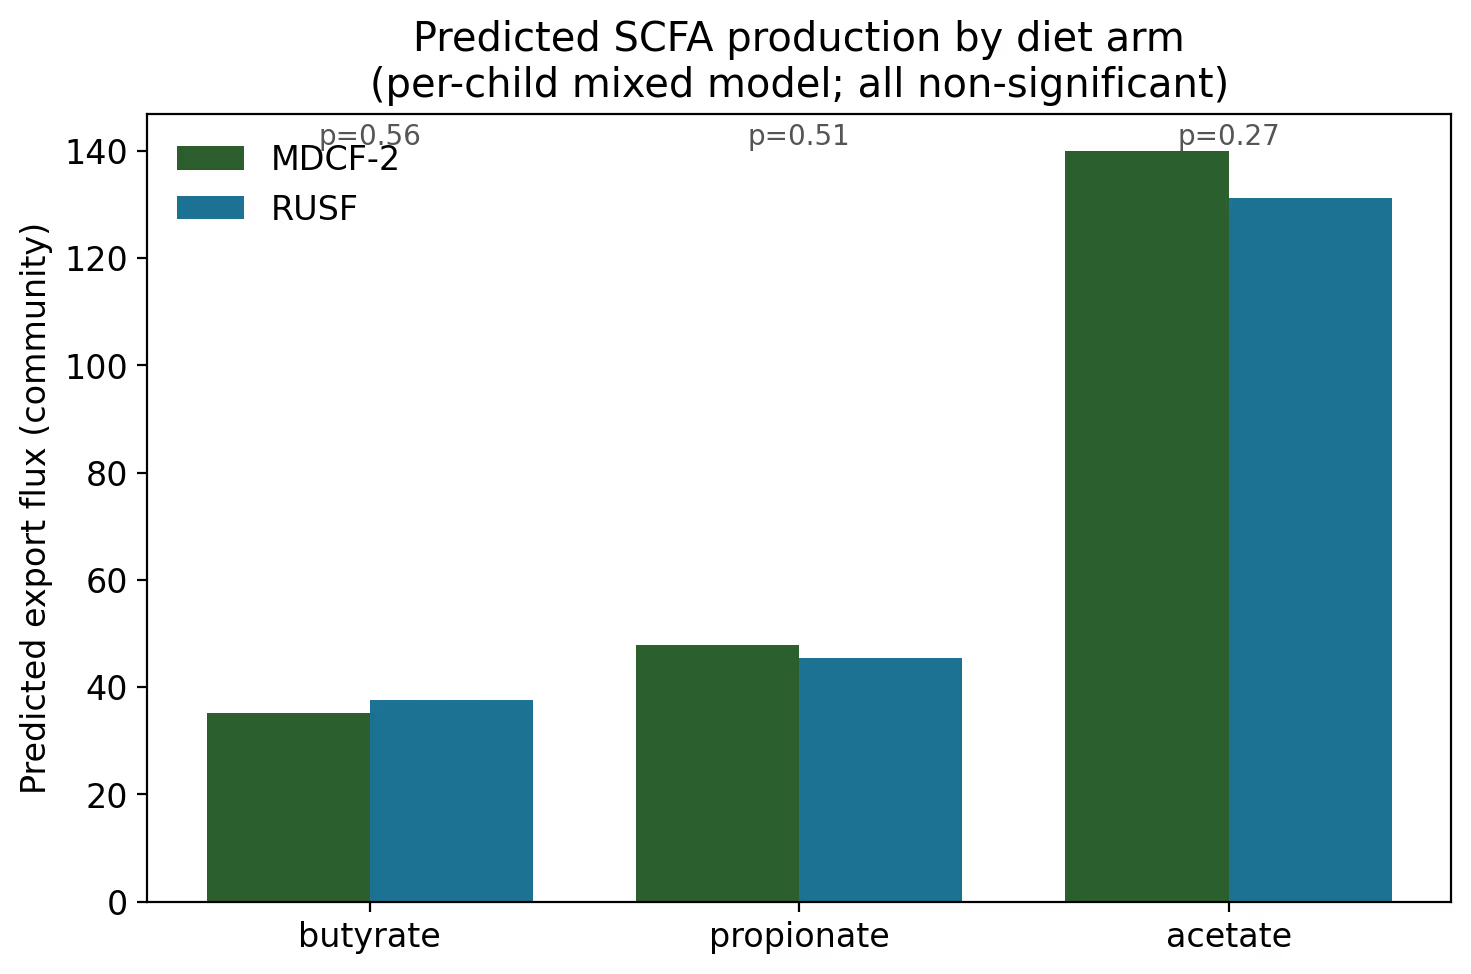
Using the mixed model of Equation (1) on predicted fluxes, none of the three principal short-chain fatty acids differed by arm (butyrate p=0.56, acetate p=0.27, propionate p=0.51; Figure 13). Extending to all 48 metabolites produced in at least 100 samples and applying the Benjamini-Hochberg control of Equation (2), zero survived as arm-associated. At the whole-community level, the model sees the two diets as metabolically equivalent, consistent with the compositional result.
A tie at the whole-community level does not settle things, because the trial’s signal was in a few specific bacteria, not in the community average. The better question is what those bacteria do and how they connect.
4.2 The molecules being traded are the right ones
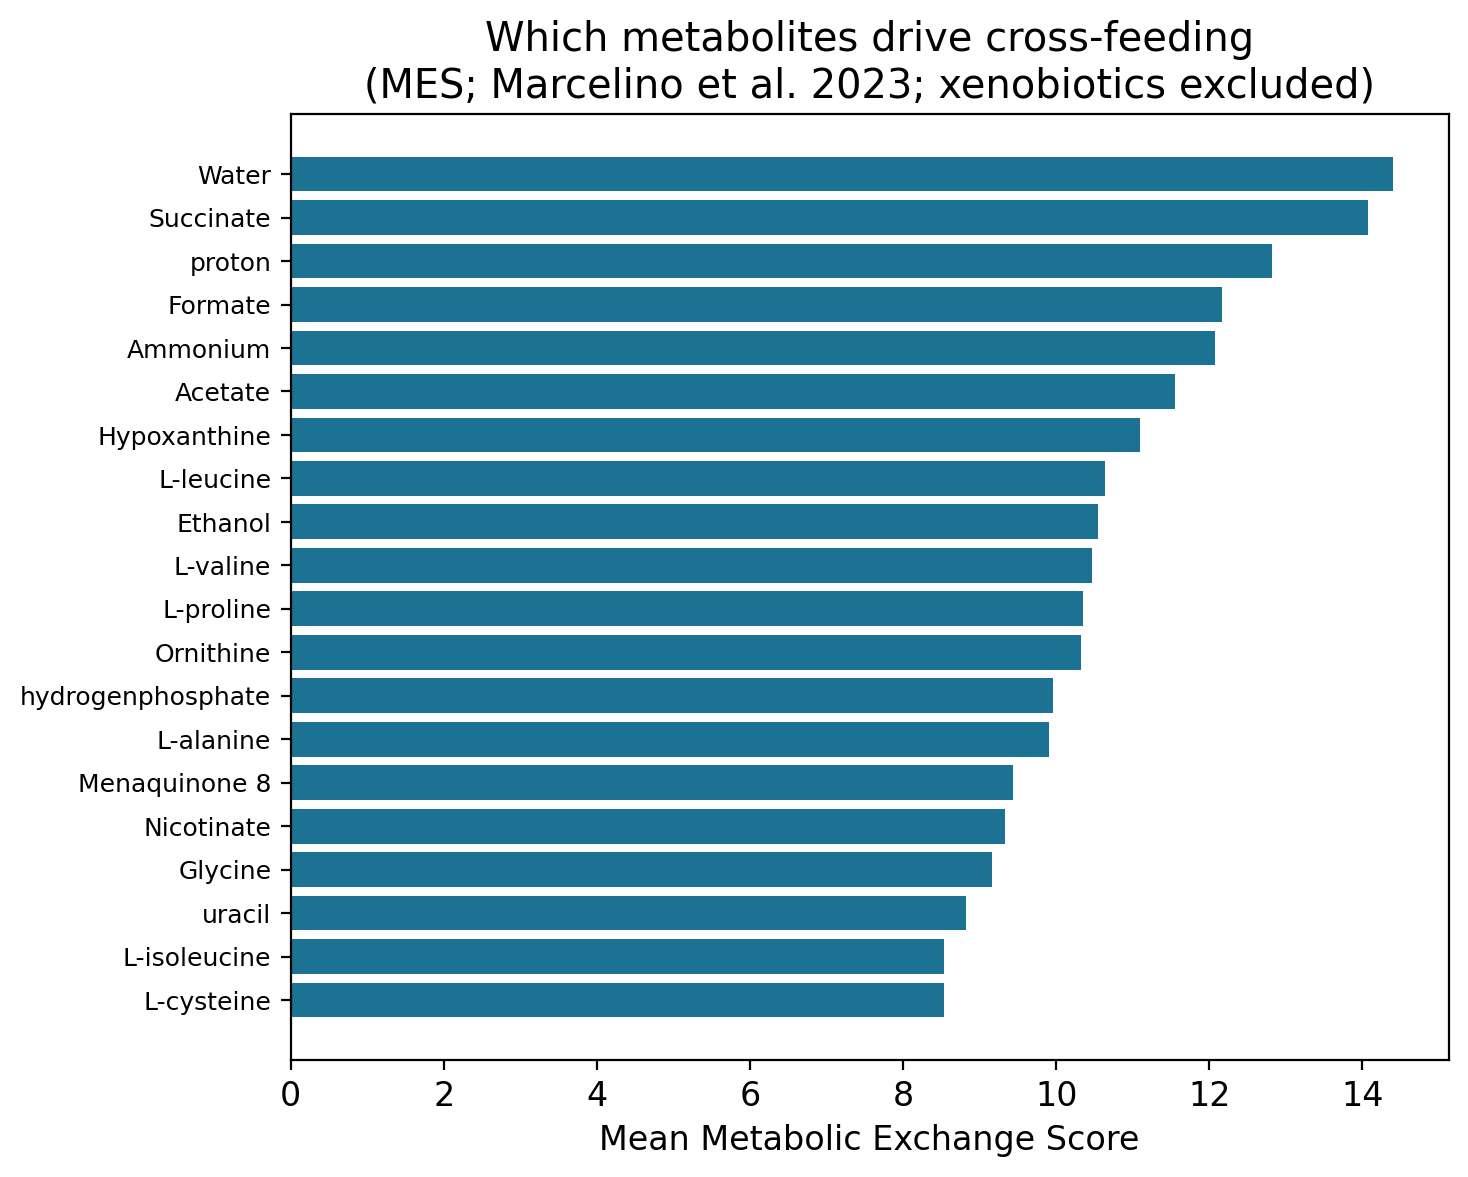
Before mapping who trades with whom, we identified what is traded. Ranked by Metabolic Exchange Score (excluding xenobiotic pseudo-metabolites from the AGORA2 drug reactions, which otherwise dominate the raw ranking), the most cross-fed metabolites are succinate, formate and acetate, with water, protons and ammonium (Figure 14). That the model independently recovers the canonical fermentation hand-off molecules is a basic validity check it passes.
4.3 The growth bacteria feed off each other
Mapping directed metabolite hand-offs among the growth-associated taxa produces a clear structure: the dominant members are net consumers, positioned downstream, living on what the rest of the community releases (Figure 15). The quantitative picture matches the known physiology of each species, which is what makes it more than a diagram:
- Prevotella is the strongest consumer in the set, taking in about 2.2× what it exports. It nets as a consumer of acetate, lactate and succinate and a producer of formate and propionate, the established Prevotella copri phenotype.
- Faecalibacterium nets as a consumer of acetate and succinate and a producer of butyrate (it exports butyrate and imports none). This is the textbook acetate-to-butyrate cross-feed, recovered here from genome content alone.
- Megasphaera is a broad consumer of acetate, lactate, succinate and formate.
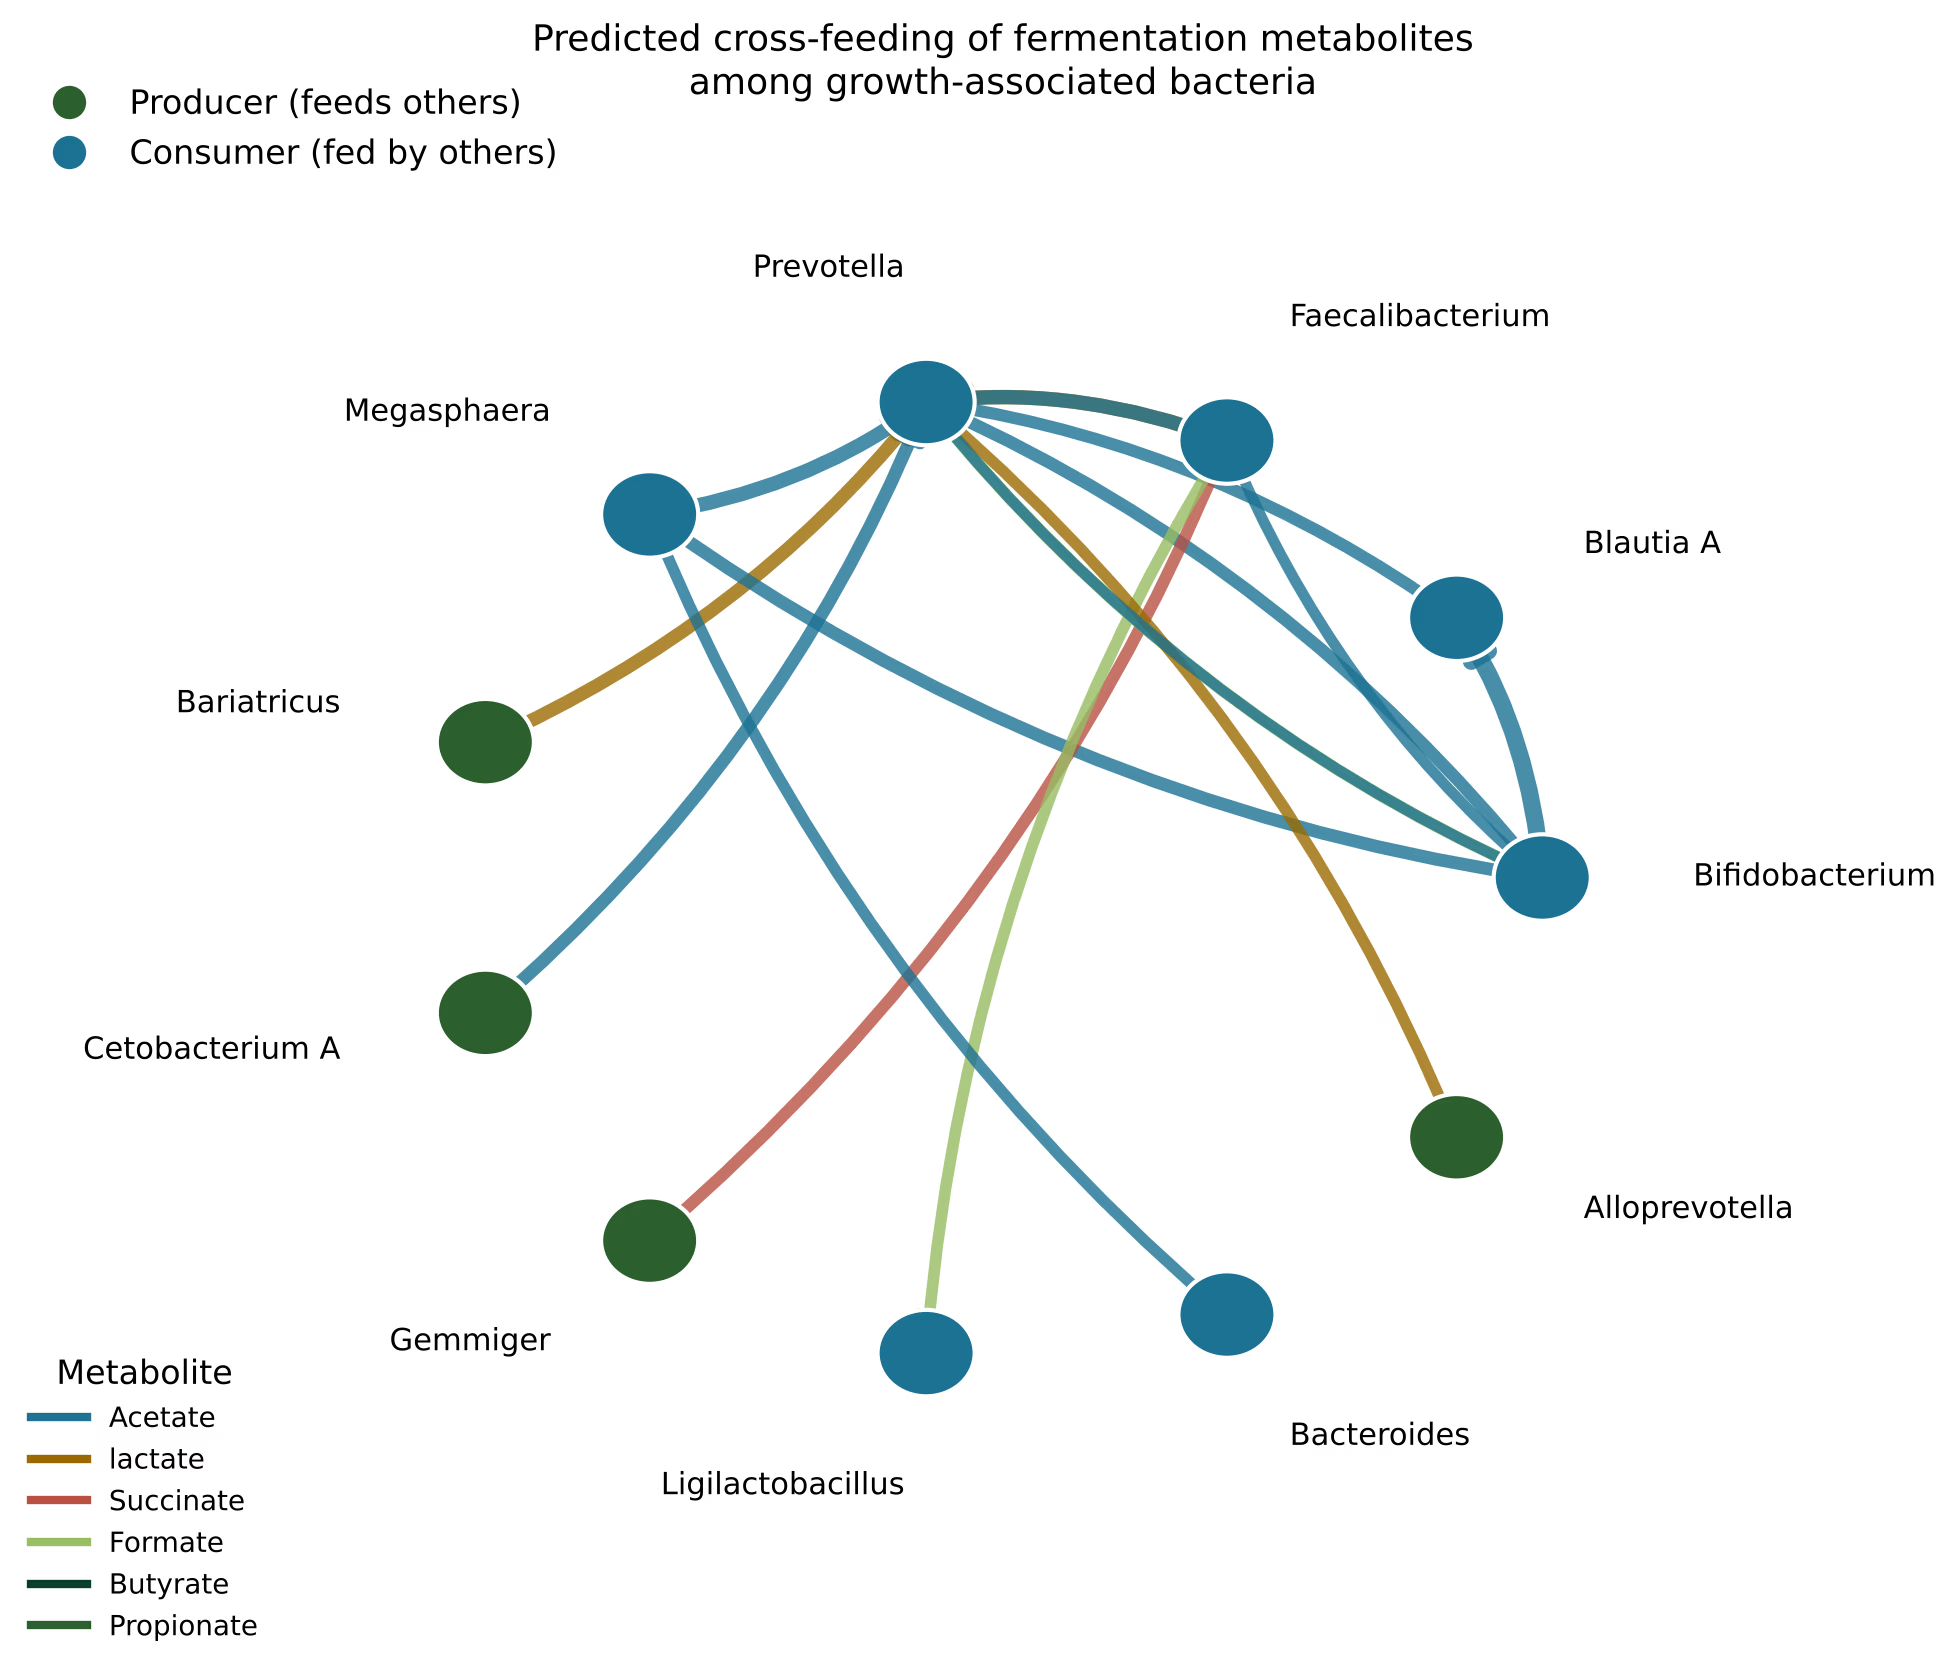
Read together, this is a production line rather than a set of independent producers: the community and Prevotella release acetate, lactate and succinate; Faecalibacterium converts acetate to butyrate; Prevotella converts succinate and lactate to propionate. One caveat keeps the claim precise: this consumer pattern is a property of the dominant growth taxa. Across the full growth-associated group the split is roughly even between net consumers and net producers, so the correct statement is “the dominant growth bacteria are consumers,” not “all of them are.”
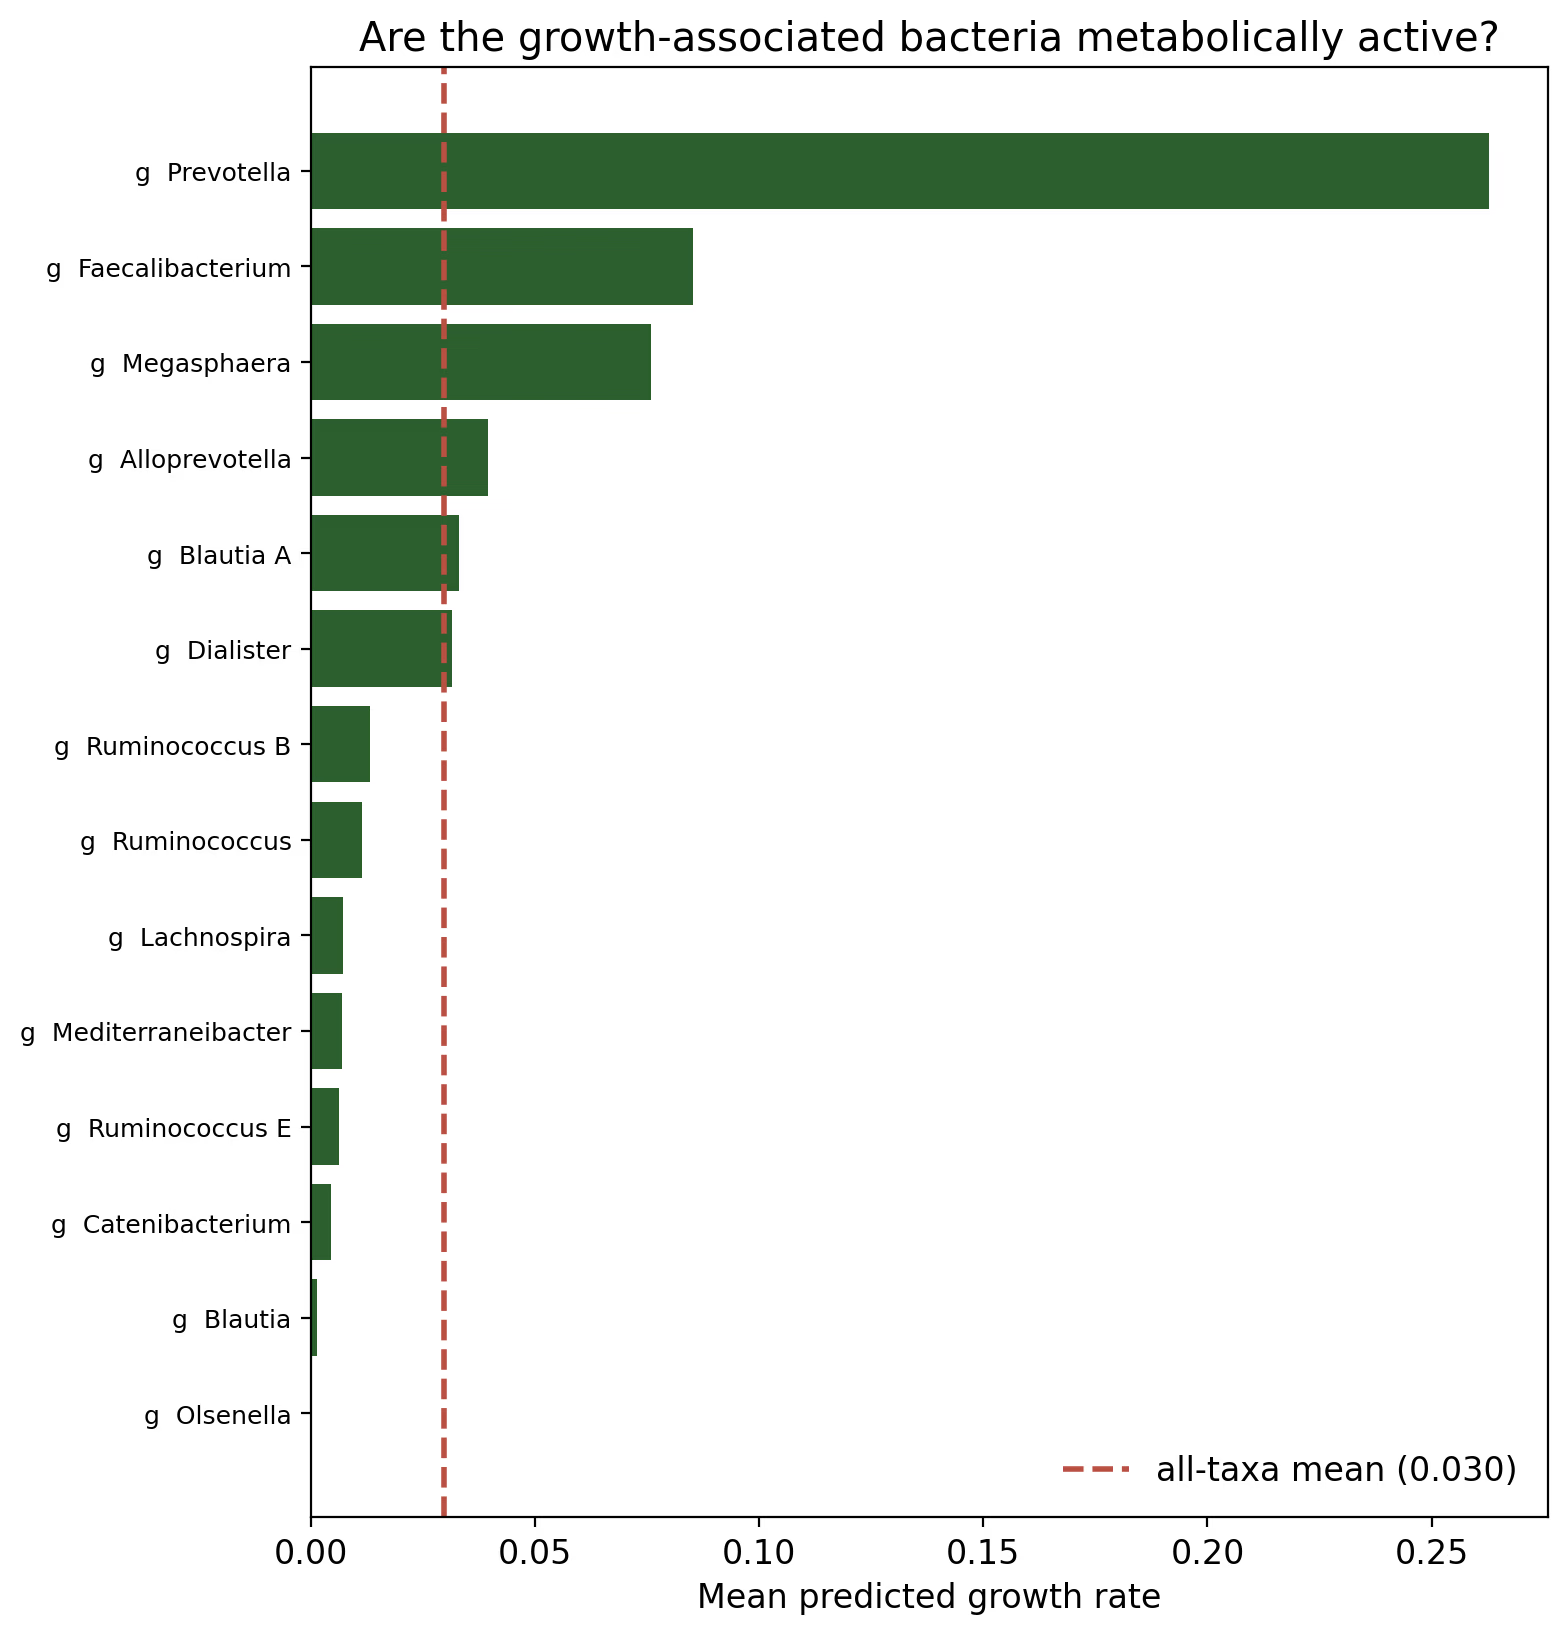
Supporting this, predicted metabolic activity (per-taxon growth rate) is more than double the community average for the growth-associated taxa (0.064 versus 0.030; Figure 16), so these are active consumers drawing on the shared pool, not passive residents.
4.4 A small model explains a backwards result
Across all 936 samples, predicted community butyrate is negatively correlated with the abundance of the growth-associated bacteria (Pearson r=−0.31, Spearman −0.38; Figure 17). On its face this seems to contradict a beneficial role. The cross-feeding structure explains it, and the minimal model of Equations (4)-(5) makes the explanation quantitative.
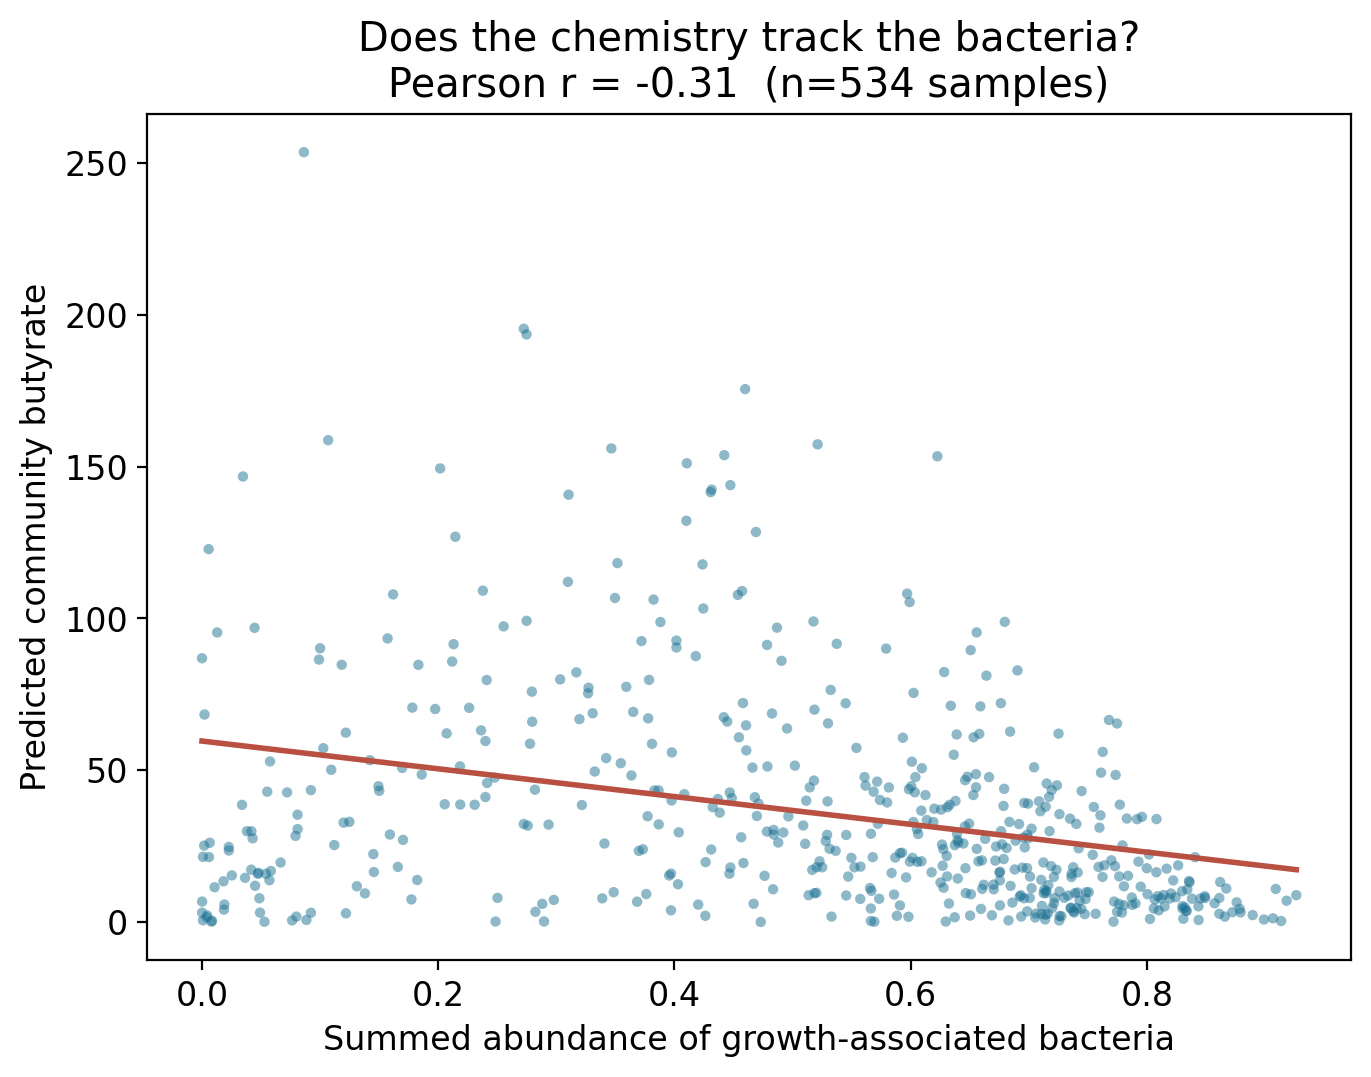
Because the growth community is dominated by the non-butyrogenic consumer C (Prevotella), expanding it draws down shared acetate A* and starves the butyrate-former F, while C also re-consumes butyrate. Solving the steady state as the community abundance G increases, both A* and free butyrate B* fall (Figure 18), reproducing the sign of the empirical correlation. The model’s slope is steeper than the data’s (the real system carries many other taxa and noise), but it demonstrates that a single, biologically grounded mechanism, resource competition for acetate, is sufficient to turn a beneficial cross-feeding community into a negative abundance-to-butyrate relationship. The negative correlation is thus a signature of downstream consumption, not evidence against a role in growth.
4.5 Fermentation drops over time
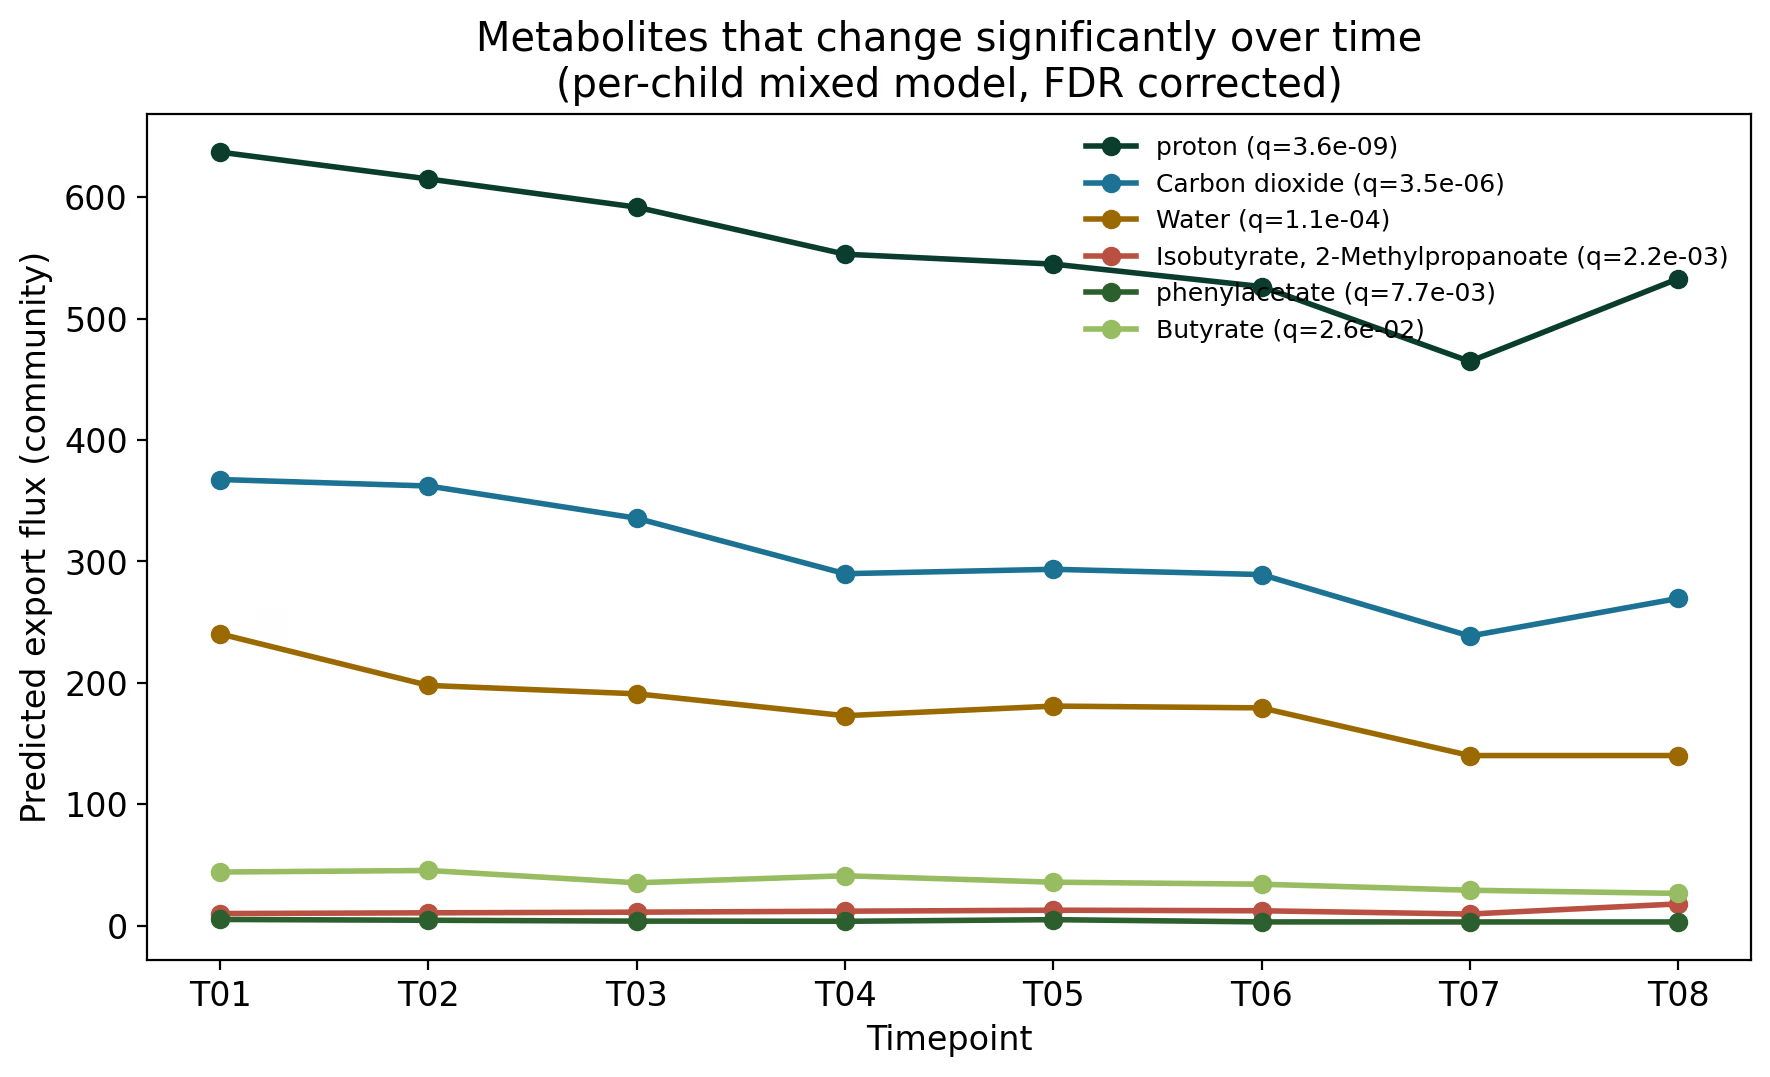
Consistent with the compositional result that time dominates diet, six metabolites changed significantly over the study under the mixed model with FDR control (Equations 1-2). Five moved together, downward: protons, carbon dioxide, water, phenylacetate and butyrate declined from first to last timepoint; only isobutyrate rose (Figure 19). Sampling was balanced (115-118 per timepoint), so this is not a sparse-data artifact.
4.6 Does the answer change on a diet that fits these children?
Everything above used the Western-adult diet that comes with the tool. That is the biggest mismatch in our whole metabolic analysis. We describe how we built the replacement diet in Section 2.7; here is what it changed. Our kids are rural Bangladeshi toddlers eating rice, lentils and a supplement, plus breast milk for the younger ones. And the food supply decides what the simulated bacteria get to eat. So we rebuilt it. We started from the Western diet and changed it to fit a rice-and-lentil diet: more staple starch and plant fiber, less fat and less of the amino acids that come mainly from meat, and we kept the milk sugars (lactose and galactose) for the breastfed kids. Every change is listed with its food reason in a table in the code bundle, so anyone can see exactly what we moved and why. Then we let the tool add any trace nutrients the bacteria really need, and we checked they could still grow: 560 of 585 bacteria grew on it. So it is a diet the bacteria can actually live on, not a starvation diet.
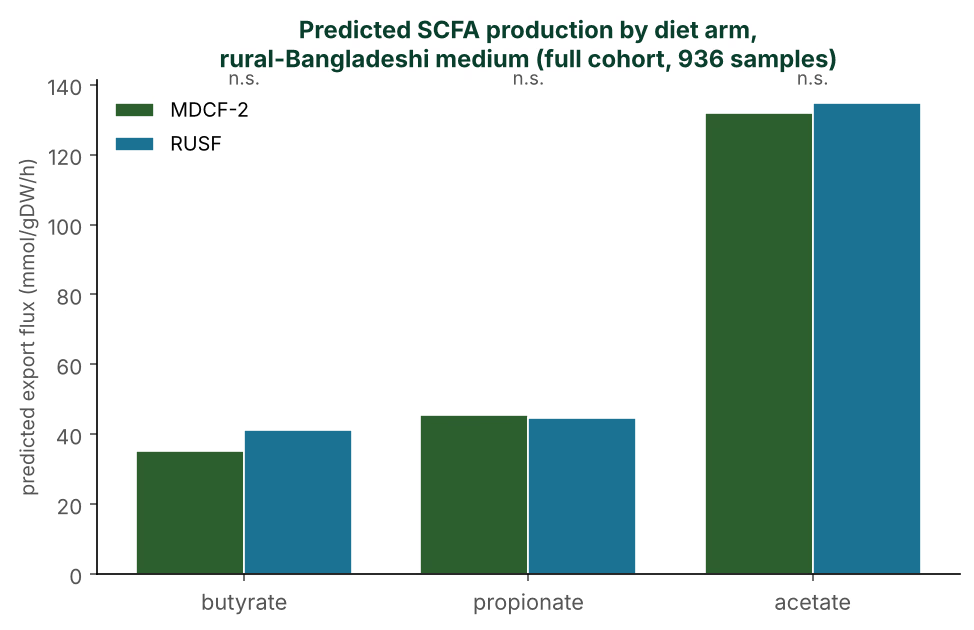
Then we re-ran the food comparison on the new diet, changing nothing else, across all 936 samples. The three main short-chain fatty acids still did not differ between the two foods (butyrate p=0.22, propionate p=0.79, acetate p=0.70, same per-kid model; Figure 20), and across the full 48-metabolite scan, zero metabolites differed by food (while 14 still differed by time). Same answer the Western diet gave, now at full strength. This closes the loophole the first result left open: the no-difference answer is not just an artifact of feeding the model a Western diet, because a diet built for these kids, run on the whole cohort, gives exactly the same result.
Two things to be upfront about
First, our diet is a reasonable approximation, not a gram-by-gram copy of a food diary. We moved nutrient groups in the direction the real diet points and wrote down every change, and the bundle explains how to build the exact version from a weighed food record if we get one. Second, we ran this on all 936 samples, the same as the Western-diet comparison, so the two sit on equal footing: the no-difference answer holds at full strength on both diets. And like the rest of the food comparison, this was never a test of the study’s growth finding, only of whether the two foods differ in predicted metabolism.5. What it all means
A few takeaways. We did not test the study’s main result (bacteria vs. each kid’s growth), because that data is private. We tested the food question instead, and finding no food difference says nothing about growth. On the food question, the two famous bacteria acted differently. Bifidobacterium really does differ between the foods, even under our strictest model, and in the same direction the study found. So there, we agree with them. Prevotella only looked different when we counted samples the sloppy way, and that difference vanished once we counted each kid properly. The study’s case for Prevotella was about growth, not about the foods, so our Prevotella result is only about the food comparison. And the thing that changed the bacteria the most was not the food at all. It was time, which we cannot cleanly separate from the kids just getting older.
The metabolic side changed how we think about the growth bacteria. Instead of each one making the good stuff alone, the model shows them working as a team of eaters. Butyrate comes from an acetate hand-off to Faecalibacterium. And because Prevotella hogs so much acetate, you get a backwards-looking result: more of these bacteria means less free butyrate. Our own small model shows the same thing, just from competition over acetate. The best part is it points to a clear next experiment: measure butyrate (and the acetate that feeds it) and watch Faecalibacterium next to the rest of the community, either by mass spec on stool or by growing the bacteria together.
5.1 How this connects to our wet-lab project
Our team has two tracks, both aimed at the same goal: helping an undernourished kid gain weight. This whole page is the modeling track. The other is our wet-lab project, where we put an enzyme called FAAH into the probiotic E. coli Nissle. FAAH breaks down OEA, a signal that tells the body it is full. The idea: the kid feels less full, eats more, and gains weight (appetite is a surprisingly overlooked angle in childhood malnutrition). Here is where the two tracks meet. An engineered bacterium does not get released into an empty test tube. It goes into the crowded community we just modeled. Will it survive? What do the other bacteria feed it? What does it give off? Those are all community-metabolism questions, which is what MICOM estimates. The food web we found, a bunch of eaters all pulling on a shared acetate pool, is the setting a new strain would land in, and you can re-run the same pipeline with the strain added to predict where it ends up before doing animal experiments.
We tried it, and the model answered something else
We went to add our FAAH reaction (it splits OEA into oleate and ethanolamine) into the community, and the first thing we found is that OEA is not in the bacteria’s shared pool at all. That is not a bug, it is the biology. OEA is a host signal: the gut lining and nerves make it and sense it, not the bacteria. So in a bacteria-only model, FAAH has nothing to act on.
The appetite effect we are chasing happens in the kid, not in the bacteria, and the model does not include the kid. To get any result, we had to add OEA to the diet by hand and label it a what-if, which just proves the point: it is not really there. The lesson is that the model tells you where its own edges are. For FAAH, the model can answer the smaller question (will our strain survive in this acetate food web, and what does it do to its neighbors), but the appetite question needs a host, not bacteria. Knowing what a model cannot answer is as useful as what it can, and it is a lot cheaper to learn that here than after a colonization experiment.
We think this helps other iGEM teams too. If a project stops at “the enzyme works in a test tube,” it has not shown the bacterium will do anything in a real gut, where all the other bacteria set the chemistry. Running a community model first is a cheap check: is the molecule you care about already traded so much that one new maker will not matter? Is your enzyme’s substrate even in the gut? Which bacteria will your strain bump into most? For anyone building a living engineered therapeutic, that check is worth doing before the first colonization experiment, not after.
The biggest catch
MICOM used a standard Western-adult diet as the food supply, because that is what comes with the tool. Our kids are undernourished toddlers eating rice, lentils and a supplement, a very different diet, and that food supply controls what the simulated bacteria get to work with. So we rebuilt the diet to match what these kids actually eat (Section 4.6). It is also the main reason we keep saying “predicted” instead of claiming these are the real amounts in their guts.Two limits run through the whole project. We did not have the per-kid growth numbers, so we could not redo the study’s main analysis. And our 16S data only names bacteria down to genus, not species. Both make our results coarser than the original study’s. And both mean that when we find nothing, it counts as weaker evidence than it would in the study’s own setup.
The complete pipeline, with the real commands and scripts for every stage above, is on our Software page.
6. Acronyms
| Acronym | Meaning |
|---|---|
| 16S rRNA | 16S ribosomal RNA, the marker gene sequenced to identify bacteria |
| ASV | Amplicon sequence variant, an exact (error-corrected) sequence |
| MDCF-2 / RUSF | Microbiota-directed complementary food 2 / ready-to-use supplementary food (the control) |
| WLZ | Weight-for-length Z-score, the trial's growth readout |
| FBA | Flux balance analysis, Equation (3) |
| SCFA | Short-chain fatty acid (acetate, propionate, butyrate) |
| MES | Metabolic Exchange Score, how widely a metabolite is cross-fed |
| FDR | False discovery rate, controlled by Benjamini-Hochberg, Equation (2) |
| ICC | Intraclass correlation ρ, the between-child variance fraction |
| PERMANOVA | Permutational multivariate analysis of variance |
References
References
- Chen RY, Mostafa I, Hibberd MC, et al. A Microbiota-Directed Food Intervention for Undernourished Children. N Engl J Med. 2021;384(16):1517-1528. doi:10.1056/NEJMoa2023294
- Gehrig JL, Venkatesh S, Chang HW, et al. Effects of microbiota-directed foods in gnotobiotic animals and undernourished children. Science. 2019;365(6449):eaau4732. doi:10.1126/science.aau4732
- Raman AS, Gehrig JL, Venkatesh S, et al. A sparse covarying unit that describes healthy and impaired human gut microbiota development. Science. 2019;365(6449):eaau4735. doi:10.1126/science.aau4735
- Bolyen E, Rideout JR, Dillon MR, et al. Reproducible, interactive, scalable and extensible microbiome data science using QIIME 2. Nat Biotechnol. 2019;37(8):852-857. doi:10.1038/s41587-019-0209-9
- Callahan BJ, McMurdie PJ, Rosen MJ, Han AW, Johnson AJA, Holmes SP. DADA2: High-resolution sample inference from Illumina amplicon data. Nat Methods. 2016;13(7):581-583. doi:10.1038/nmeth.3869
- Quast C, Pruesse E, Yilmaz P, et al. The SILVA ribosomal RNA gene database project: improved data processing and web-based tools. Nucleic Acids Res. 2013;41(D1):D590-D596. doi:10.1093/nar/gkt1209
- Parks DH, Chuvochina M, Rinke C, Mussig AJ, Chaumeil PA, Hugenholtz P. GTDB: an ongoing census of bacterial and archaeal diversity through a phylogenetically consistent, rank-normalized and complete genome-based taxonomy. Nucleic Acids Res. 2022;50(D1):D785-D794. doi:10.1093/nar/gkab776
- Bokulich NA, Kaehler BD, Rideout JR, et al. Optimizing taxonomic classification of marker-gene amplicon sequences with QIIME 2's q2-feature-classifier plugin. Microbiome. 2018;6(1):90. doi:10.1186/s40168-018-0470-z
- Katoh K, Standley DM. MAFFT multiple sequence alignment software version 7: improvements in performance and usability. Mol Biol Evol. 2013;30(4):772-780. doi:10.1093/molbev/mst010
- Price MN, Dehal PS, Arkin AP. FastTree 2 -- approximately maximum-likelihood trees for large alignments. PLoS One. 2010;5(3):e9490. doi:10.1371/journal.pone.0009490
- Faith DP. Conservation evaluation and phylogenetic diversity. Biol Conserv. 1992;61(1):1-10. doi:10.1016/0006-3207(92)91201-3
- Lozupone C, Knight R. UniFrac: a new phylogenetic method for comparing microbial communities. Appl Environ Microbiol. 2005;71(12):8228-8235. doi:10.1128/AEM.71.12.8228-8235.2005
- Anderson MJ. A new method for non-parametric multivariate analysis of variance. Austral Ecol. 2001;26(1):32-46. doi:10.1111/j.1442-9993.2001.01070.pp.x
- Lin H, Peddada SD. Analysis of compositions of microbiomes with bias correction. Nat Commun. 2020;11(1):3514. doi:10.1038/s41467-020-17041-7
- Mallick H, Rahnavard A, McIver LJ, et al. Multivariable association discovery in population-scale meta-omics studies. PLoS Comput Biol. 2021;17(11):e1009442. doi:10.1371/journal.pcbi.1009442
- Gloor GB, Macklaim JM, Pawlowsky-Glahn V, Egozcue JJ. Microbiome datasets are compositional: and this is not optional. Front Microbiol. 2017;8:2224. doi:10.3389/fmicb.2017.02224
- Benjamini Y, Hochberg Y. Controlling the false discovery rate: a practical and powerful approach to multiple testing. J R Stat Soc Series B. 1995;57(1):289-300. doi:10.1111/j.2517-6161.1995.tb02031.x
- Bates D, Machler M, Bolker B, Walker S. Fitting linear mixed-effects models using lme4. J Stat Softw. 2015;67(1):1-48. doi:10.18637/jss.v067.i01
- Seabold S, Perktold J. Statsmodels: econometric and statistical modeling with Python. Proc 9th Python in Science Conf. 2010:92-96. doi:10.25080/Majora-92bf1922-011
- Diener C, Gibbons SM, Resendis-Antonio O. MICOM: metagenome-scale modeling to infer metabolic interactions in the gut microbiota. mSystems. 2020;5(1):e00606-19. doi:10.1128/mSystems.00606-19
- Heinken A, Hertel J, Acharya G, et al. Genome-scale metabolic reconstruction of 7,302 human microorganisms for personalized medicine. Nat Biotechnol. 2023;41(9):1320-1331. doi:10.1038/s41587-022-01628-0
- Orth JD, Thiele I, Palsson BO. What is flux balance analysis? Nat Biotechnol. 2010;28(3):245-248. doi:10.1038/nbt.1614
- Marcelino VR, Welsh C, Diener C, et al. Disease-specific loss of microbial cross-feeding interactions in the human gut. Nat Commun. 2023;14(1):6546. doi:10.1038/s41467-023-42112-w
- Louis P, Flint HJ. Formation of propionate and butyrate by the human colonic microbiota. Environ Microbiol. 2017;19(1):29-41. doi:10.1111/1462-2920.13589
- Riviere A, Selak M, Lantin D, Leroy F, De Vuyst L. Bifidobacteria and butyrate-producing colon bacteria: importance and strategies for their stimulation in the human gut. Front Microbiol. 2016;7:979. doi:10.3389/fmicb.2016.00979
- Wrzosek L, Miquel S, Noordine ML, et al. Bacteroides thetaiotaomicron and Faecalibacterium prausnitzii influence the production of mucus glycans and the development of goblet cells. BMC Biol. 2013;11:61. doi:10.1186/1741-7007-11-61
- Flint HJ, Scott KP, Duncan SH, Louis P, Forano E. Microbial degradation of complex carbohydrates in the gut. Gut Microbes. 2012;3(4):289-306. doi:10.4161/gmic.19897
- Koh A, De Vadder F, Kovatcheva-Datchary P, Backhed F. From dietary fiber to host physiology: short-chain fatty acids as key bacterial metabolites. Cell. 2016;165(6):1332-1345. doi:10.1016/j.cell.2016.05.041
- Precup G, Vodnar DC. Gut Prevotella as a possible biomarker of diet and its eubiotic versus dysbiotic roles: a comprehensive literature review. Br J Nutr. 2019;122(2):131-140. doi:10.1017/S0007114519000680
- Subramanian S, Huq S, Yatsunenko T, et al. Persistent gut microbiota immaturity in malnourished Bangladeshi children. Nature. 2014;510(7505):417-421. doi:10.1038/nature13421
- McDonald D, Price MN, Goodrich J, et al. An improved Greengenes taxonomy with explicit ranks for ecological and evolutionary analyses of bacteria and archaea. ISME J. 2012;6(3):610-618. doi:10.1038/ismej.2011.139
- Ebrahim A, Lerman JA, Palsson BO, Hyduke DR. COBRApy: constraints-based reconstruction and analysis for Python. BMC Syst Biol. 2013;7:74. doi:10.1186/1752-0509-7-74
- Toni AT, Girma T, Hetherington MM, Gonzales GB, Forde CG. Appetite and childhood malnutrition: a narrative review identifying evidence gaps between clinical practice and research. Appetite. 2025;207:107866. doi:10.1016/j.appet.2025.107866
- Fu J, Gaetani S, Oveisi F, et al. Oleylethanolamide regulates feeding and body weight through activation of the nuclear receptor PPAR-alpha. Nature. 2003;425(6953):90-93. doi:10.1038/nature01921